dotnet-counters is a performance monitoring tool for .NET Core and was introduced with .NET Core 3.0. With dotnet-counters you can observe performance counter values that are published via the EventCounter API while your application is running. The EventCounter API is an alternative variant of the performance counters for Windows.
Now you may ask yourself why an additional monitoring tool for .NET Core is necessary?
Well, because performance counters for .NET only work under Windows, while .NET Core can also run Linux or macOS. As a way to make performance counters platform-independent, it needs a new API to read them on other systems as well. And this is where EventCounter API comes in.
Runtime Counters
Various .NET Core components publish perf counters using the EventCounter API while running:
- System.Runtime see RuntimeEventSource::OnEventCommand
- Microsoft.AspNetCore.Hosting see HostingEventSource::OnEventCommand
- Microsoft.AspNetCore.Http.Connections see HttpConnectionsEventSource::OnEventCommand
An incomplete list of counters can be retrieved with the following command
$ dotnet-counters list
Install dotnet-counters
All .NET Core runtime diagnostic tools can be installed as .NET Core global tool and run from the commandline. The installation of dotnet-counters is really simple. Just open a terminal and use the dotnet tool install command:
$ dotnet tool install --global dotnet-counters
You can update the tool with dotnet tool update if its already installed
$ dotnet tool update --global dotnet-counters
Or simple trigger the removal with dotnet tool uninstall, if you don’t need/use it anymore
$ dotnet tool uninstall --global dotnet-counters
Monitor Performance Counters
Let’s create a simple web application using the built-in ASP.NET Core Empty web template.
$ dotnet new web --name perf-counter
The application generated with dotnet new web is quite simple, it just returns hello world to the browser. To show the functionality of dotnet-counters, this small application is sufficient. Now start the application with dotnet run.
To monitor the running application, we need the appropriate process id. With dotnet counters ps a list of all running .NET core processes can be retrieved, including process name and process id:
$ dotnet counters ps
    50415 perf-counter /home/stef/dev/perf-counter/bin/Debug/netcoreapp3.1/perf-counter
Starting with a monitoring session is easy. Once again use the dotnet counters command, but this time with the ”–monitor” parameter. The –providers parameter can be used to define the runtime components to be monitored.
$ dotnet counters monitor --process-id 50415 --providers Microsoft.AspNetCore.Hosting System.Runtime
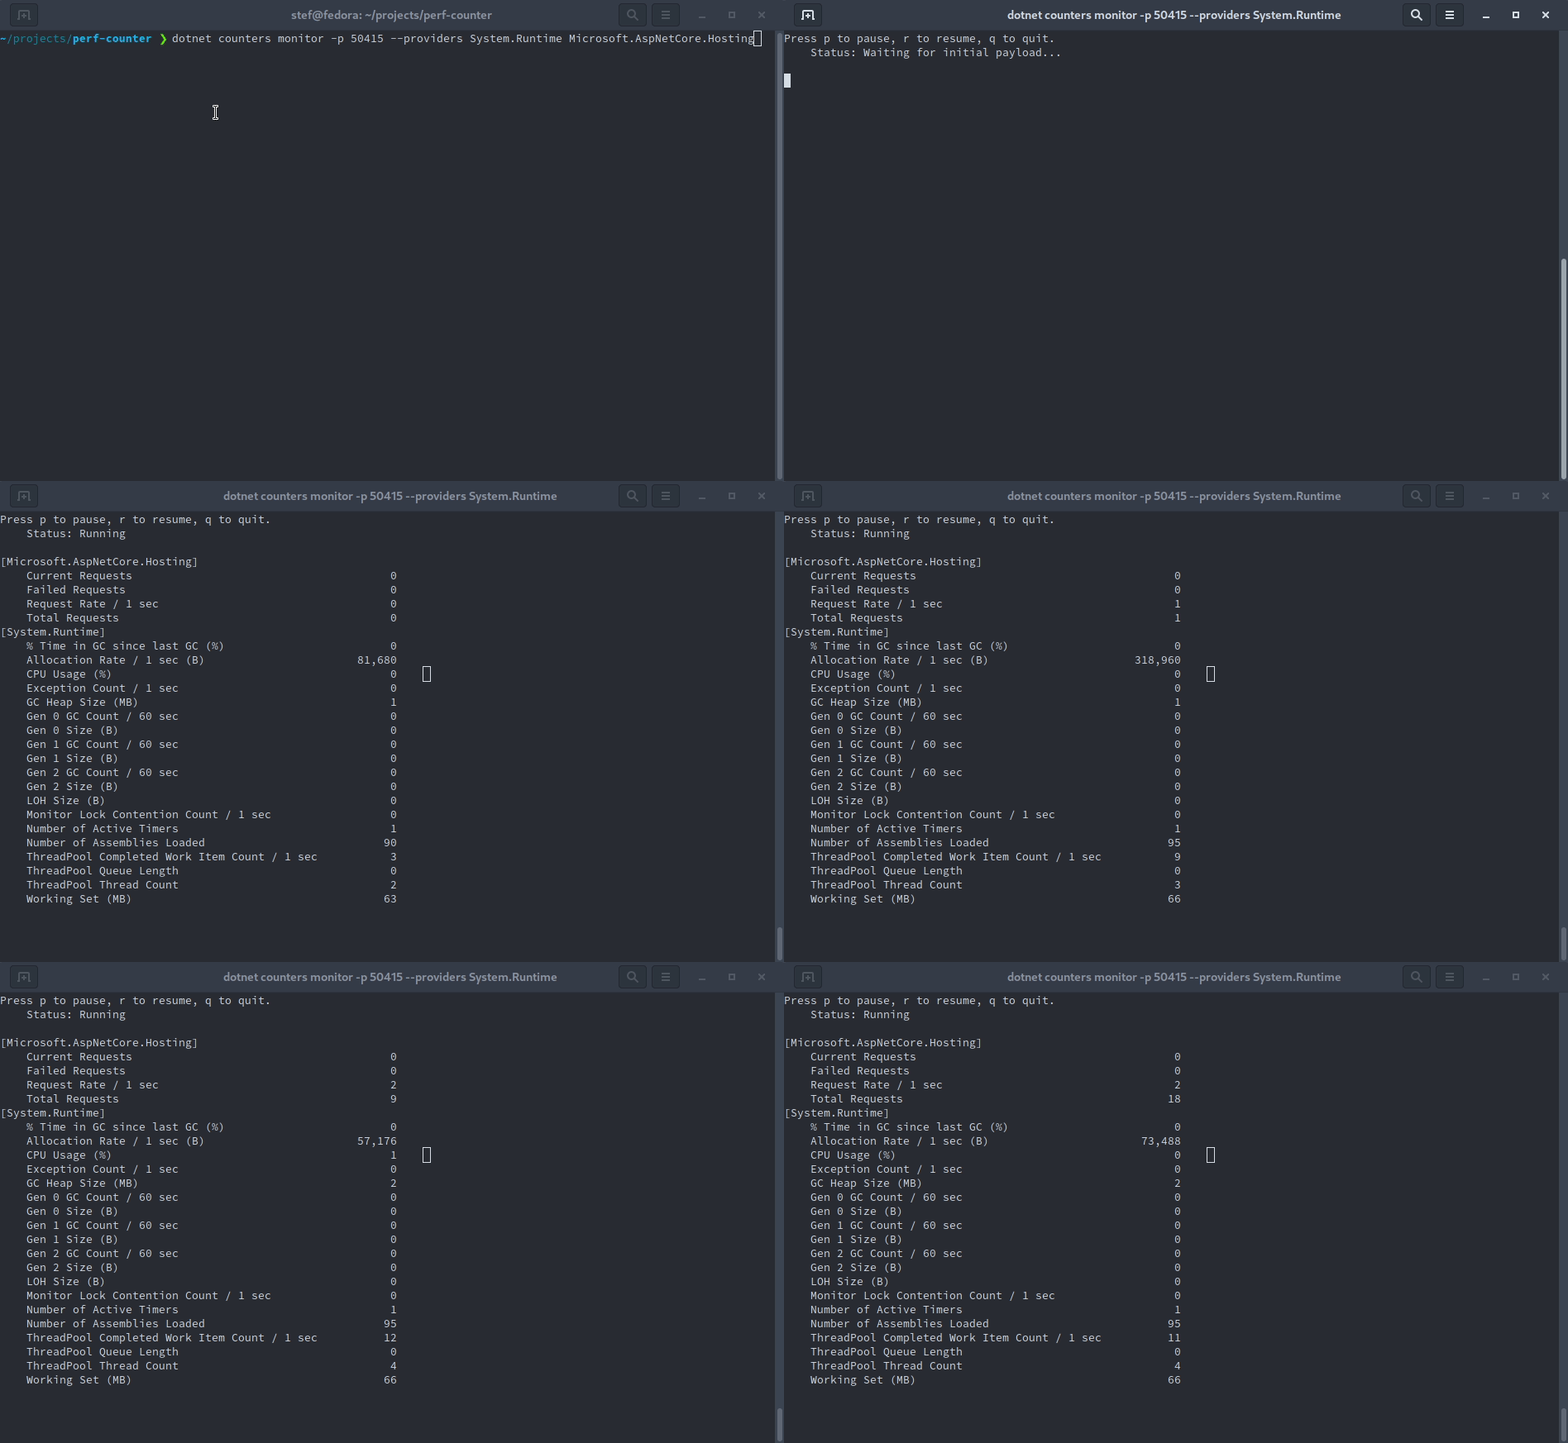
In my case, i’ve enabled the Microsoft.AspNetCore.Hosting and the System.Runtime providers. With Microsoft.AspNetCore.Hosting you can watch things like Current Requests or Request Rate / 1 sec, System.Runtime provides counters about the runtime like CPU Usage (%) or LOH Size (B).
Open the url http://localhost:5000 in a browser and press F5 a few times to simulate some traffic. Several counters should now change as shown below

BYOEC (Bring your own event counters)
The EventCounter API makes it really easy to write your own event counters and integrate them into your application. Write your own class and inherit from System.Diagnostics.Tracing.EventSource. It makes sense to mark your event counter with the EventSourceAttribute which lets you define a name and also a GUID
[EventSource(Name = "MyEventCounter")]
public sealed class MyEventCounterSource : EventSource
{
    public readonly static MyEventCounterSource EventSource = new MyEventCounterSource();

    private readonly PollingCounter _incrementingCounter1;

    private int _routeCounter1;

    private MyEventCounterSource() : base(EventSourceSettings.EtwSelfDescribingEventFormat)
    {
        _incrementingCounter1 = new PollingCounter("route-counter-1", this, () => _routeCounter1);
    }

    public void CountRoute1()
    {
        Interlocked.Increment(ref _routeCounter1);
    }
}
Keep in mind that the method CountRoute1 can be called by different threads. For this reason, make sure that the method updates the _routeCounter1 variable in a thread-safe way. That’s why i’m using the Interlocked.Increment statement. With the help of singleton property MyEventCounterSource.EventSource, you can integrate MyEventCounterSource easily into your own application.
public class Startup
{
    public void Configure(IApplicationBuilder app, IWebHostEnvironment env)
    {
        app.UseRouting();
        app.UseEndpoints(endpoints =>
        {
            endpoints.MapGet("/", async context =>
            {
                await context.Response.WriteAsync("Hello World!");
            });

            endpoints.MapGet("/route1", async context =>
            {
                MyEventCounterSource.EventSource.CountRoute1();
                await context.Response.WriteAsync("Hello Route1!");
            });
        });
    }
}
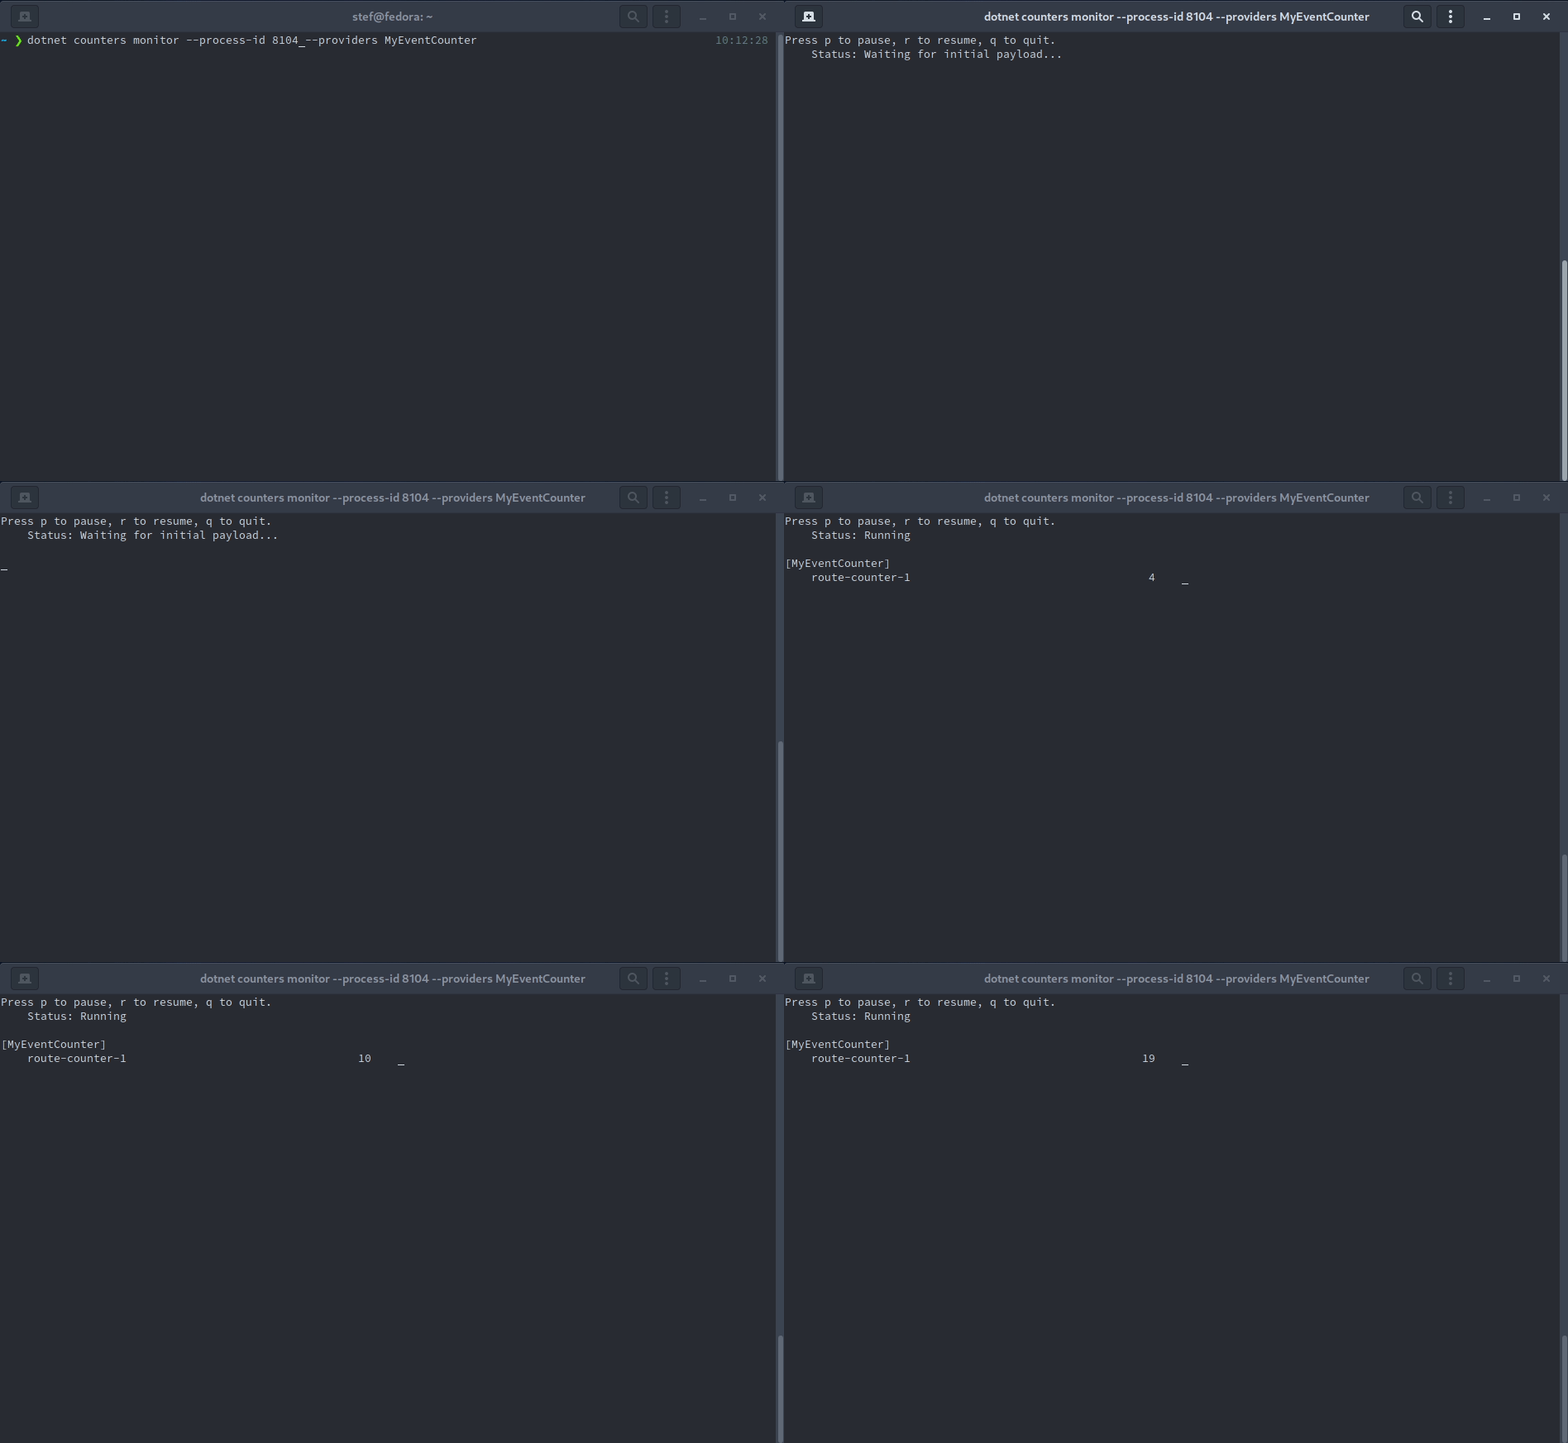
Now start the monitoring session again, but this time we enable our MyEventCounter provider
$ dotnet counters monitor --process-id 50415 --providers MyEventCounter
Open a browser and navigate to http://localhost:5000/route1. Make sure the endpoint is called a few times so that the changes are visible in the monitor
