<?xml version="1.0" encoding="utf-8"?><feed xmlns="http://www.w3.org/2005/Atom" ><generator uri="https://jekyllrb.com/" version="4.4.1">Jekyll</generator><link href="https://www.stefangeiger.ch/feed.xml" rel="self" type="application/atom+xml" /><link href="https://www.stefangeiger.ch/" rel="alternate" type="text/html" /><updated>2026-09-10T18:40:55+00:00</updated><id>https://www.stefangeiger.ch/feed.xml</id><title type="html">Stefan Geiger</title><entry><title type="html">SOS Cheat Sheet: Debugging .NET Dumps on Linux</title><link href="https://www.stefangeiger.ch/2026/09/10/dotnet-sos-cheat-sheet.html" rel="alternate" type="text/html" title="SOS Cheat Sheet: Debugging .NET Dumps on Linux" /><published>2026-09-10T00:00:00+00:00</published><updated>2026-09-10T00:00:00+00:00</updated><id>https://www.stefangeiger.ch/2026/09/10/dotnet-sos-cheat-sheet</id><content type="html" xml:base="https://www.stefangeiger.ch/2026/09/10/dotnet-sos-cheat-sheet.html"><![CDATA[<p>A few years ago I wrote a <a href="/2019/05/11/windbg-cheat-sheet.html">WinDbg Cheat Sheet for .NET Developers</a>
and later a walkthrough of <a href="/2023/10/03/dotnet-memory-analysis-linux.html">.NET Memory Analysis with Linux</a>.
The memory post covers the “the heap keeps growing” case in detail: <code class="language-plaintext highlighter-rouge">dumpheap</code>, <code class="language-plaintext highlighter-rouge">dumpobj</code>,
<code class="language-plaintext highlighter-rouge">objsize</code>, <code class="language-plaintext highlighter-rouge">gcroot</code>, <code class="language-plaintext highlighter-rouge">dotnet-counters</code> and <code class="language-plaintext highlighter-rouge">dotnet-gcdump</code>.</p>

<p>This post pulls the threads of those two older posts together and is really a runbook for my own
future self: the companion for everything you find in a production dump that <em>isn’t</em> a plain leak —
a <strong>hung request</strong>, a <strong>deadlock</strong>, an <strong>unhandled exception</strong> that took the process down, or a
<strong>finalizer thread</strong> that stopped doing its job. It is a lookup table, ordered by symptom, and
every command output below was produced on <strong>.NET 10</strong> with <code class="language-plaintext highlighter-rouge">dotnet-dump</code> on Fedora — not copied
from the docs.</p>

<blockquote>
  <p>Note: This post was put together with the help of an <strong>AI assistant</strong></p>
</blockquote>

<h2 id="sos-is-just-windbg-without-the-">SOS is just WinDbg without the <code class="language-plaintext highlighter-rouge">!</code></h2>

<p><a href="https://learn.microsoft.com/en-us/dotnet/core/diagnostics/sos-debugging-extension">SOS</a> is the
debugger extension that teaches a native debugger about the CLR. On Windows you load it into WinDbg
and call every command with a leading <code class="language-plaintext highlighter-rouge">!</code> (<code class="language-plaintext highlighter-rouge">!clrstack</code>, <code class="language-plaintext highlighter-rouge">!dumpheap</code>). On Linux the same commands
ship <em>inside</em> <a href="https://learn.microsoft.com/en-us/dotnet/core/diagnostics/dotnet-dump"><code class="language-plaintext highlighter-rouge">dotnet-dump</code></a>,
so you type them without the <code class="language-plaintext highlighter-rouge">!</code>.</p>

<table>
  <thead>
    <tr>
      <th style="text-align: left">Task</th>
      <th style="text-align: left">WinDbg</th>
      <th style="text-align: left"><code class="language-plaintext highlighter-rouge">dotnet dump analyze</code></th>
    </tr>
  </thead>
  <tbody>
    <tr>
      <td style="text-align: left">Managed call stack (current thread)</td>
      <td style="text-align: left"><code class="language-plaintext highlighter-rouge">!clrstack</code></td>
      <td style="text-align: left"><code class="language-plaintext highlighter-rouge">clrstack</code></td>
    </tr>
    <tr>
      <td style="text-align: left">All managed threads</td>
      <td style="text-align: left"><code class="language-plaintext highlighter-rouge">!threads</code></td>
      <td style="text-align: left"><code class="language-plaintext highlighter-rouge">clrthreads</code></td>
    </tr>
    <tr>
      <td style="text-align: left">Switch thread</td>
      <td style="text-align: left"><code class="language-plaintext highlighter-rouge">~&lt;n&gt;s</code></td>
      <td style="text-align: left"><code class="language-plaintext highlighter-rouge">setthread &lt;n&gt;</code></td>
    </tr>
    <tr>
      <td style="text-align: left">Managed stacks of all threads</td>
      <td style="text-align: left"><code class="language-plaintext highlighter-rouge">~*e !clrstack</code></td>
      <td style="text-align: left"><code class="language-plaintext highlighter-rouge">clrstack -all</code></td>
    </tr>
    <tr>
      <td style="text-align: left">Grouped (“parallel”) stacks</td>
      <td style="text-align: left"><em>IDE only</em></td>
      <td style="text-align: left"><code class="language-plaintext highlighter-rouge">pstacks</code></td>
    </tr>
    <tr>
      <td style="text-align: left">Monitor / <code class="language-plaintext highlighter-rouge">lock</code> ownership</td>
      <td style="text-align: left"><code class="language-plaintext highlighter-rouge">!syncblk</code></td>
      <td style="text-align: left"><code class="language-plaintext highlighter-rouge">syncblk</code></td>
    </tr>
    <tr>
      <td style="text-align: left">Current exception</td>
      <td style="text-align: left"><code class="language-plaintext highlighter-rouge">!pe</code></td>
      <td style="text-align: left"><code class="language-plaintext highlighter-rouge">pe</code></td>
    </tr>
    <tr>
      <td style="text-align: left">Objects on the stack</td>
      <td style="text-align: left"><code class="language-plaintext highlighter-rouge">!dso</code></td>
      <td style="text-align: left"><code class="language-plaintext highlighter-rouge">dso</code></td>
    </tr>
    <tr>
      <td style="text-align: left">Finalizable objects</td>
      <td style="text-align: left"><code class="language-plaintext highlighter-rouge">!finalizequeue</code></td>
      <td style="text-align: left"><code class="language-plaintext highlighter-rouge">finalizequeue</code></td>
    </tr>
    <tr>
      <td style="text-align: left">Runtime version</td>
      <td style="text-align: left"><code class="language-plaintext highlighter-rouge">!eeversion</code></td>
      <td style="text-align: left"><code class="language-plaintext highlighter-rouge">eeversion</code></td>
    </tr>
  </tbody>
</table>

<h2 id="setup">Setup</h2>

<p>Install the tool once (globally):</p>

<div class="language-sh highlighter-rouge"><div class="highlight"><pre class="highlight"><code>dotnet tool <span class="nb">install</span> <span class="nt">--global</span> dotnet-dump
</code></pre></div></div>

<blockquote>
  <p>On a minimal container image without ICU, <code class="language-plaintext highlighter-rouge">dotnet</code> refuses to start. Export
<code class="language-plaintext highlighter-rouge">DOTNET_SYSTEM_GLOBALIZATION_INVARIANT=1</code> (or install <code class="language-plaintext highlighter-rouge">libicu</code>) before running any of the
commands below.
See <a href="https://learn.microsoft.com/en-us/dotnet/core/install/linux#manual-installation">Linux Manual installation</a> and <a href="https://learn.microsoft.com/en-us/dotnet/core/extensions/globalization-icu">.NET globalization and ICU</a></p>
</blockquote>

<p>Collecting a dump of a <strong>running</strong> process:</p>

<div class="language-sh highlighter-rouge"><div class="highlight"><pre class="highlight"><code>dotnet dump collect <span class="nt">-p</span> &lt;PID&gt; <span class="nt">--type</span> Full
</code></pre></div></div>

<p>For a process that <strong>crashes</strong>, let the runtime write the dump for you. <a href="https://learn.microsoft.com/en-us/dotnet/core/diagnostics/collect-dumps-crash">Set these environment
variables</a> before starting the app and you get a dump at the exact moment of the unhandled
exception, with no debugger attached:</p>

<div class="language-sh highlighter-rouge"><div class="highlight"><pre class="highlight"><code><span class="nb">export </span><span class="nv">DOTNET_DbgEnableMiniDump</span><span class="o">=</span>1
<span class="nb">export </span><span class="nv">DOTNET_DbgMiniDumpType</span><span class="o">=</span>4          <span class="c"># 4 = full dump</span>
<span class="nb">export </span><span class="nv">DOTNET_DbgMiniDumpName</span><span class="o">=</span>/tmp/crash.dmp
</code></pre></div></div>

<p>Then open the dump:</p>

<div class="language-sh highlighter-rouge"><div class="highlight"><pre class="highlight"><code>dotnet dump analyze /tmp/crash.dmp
</code></pre></div></div>

<p>That drops you into an interactive <code class="language-plaintext highlighter-rouge">&gt;</code> prompt. Every heading below is one command you run there.
For scripting, pass commands with <code class="language-plaintext highlighter-rouge">-c</code>:</p>

<div class="language-sh highlighter-rouge"><div class="highlight"><pre class="highlight"><code>dotnet dump analyze crash.dmp <span class="nt">-c</span> <span class="s2">"clrthreads"</span> <span class="nt">-c</span> <span class="s2">"pe -nested"</span> <span class="nt">-c</span> <span class="s2">"exit"</span>
</code></pre></div></div>

<h3 id="the-sample-program">The sample program</h3>

<p>All output below comes from one small console app that reproduces a scenario per command-line
argument (<code class="language-plaintext highlighter-rouge">lock</code>, <code class="language-plaintext highlighter-rouge">deadlock</code>, <code class="language-plaintext highlighter-rouge">crash</code>, <code class="language-plaintext highlighter-rouge">finalizer</code>, <code class="language-plaintext highlighter-rouge">threads</code>) and prints its PID on startup. The
interesting bits are shown inline with each section.</p>

<p>Download: <a href="/assets/code/SosDemo/Program.cs" download="Program.cs"><strong>Program.cs</strong></a>. To run it:</p>

<div class="language-sh highlighter-rouge"><div class="highlight"><pre class="highlight"><code><span class="nb">mkdir </span>SosDemo <span class="o">&amp;&amp;</span> <span class="nb">cd </span>SosDemo
dotnet new console
curl <span class="nt">-O</span> https://www.stefangeiger.ch/assets/code/SosDemo/Program.cs
dotnet run lock <span class="c"># or: deadlock | crash | finalizer | threads</span>
</code></pre></div></div>

<h2 id="threads--stacks">Threads &amp; stacks</h2>

<p><code class="language-plaintext highlighter-rouge">clrthreads</code> lists every managed thread. The <strong>DBG</strong> column is the id you pass to <code class="language-plaintext highlighter-rouge">setthread</code>,
<strong>OSID</strong> is the native thread id (hex), and the last column flags a thread that currently has a
managed exception in flight.</p>

<div class="language-text highlighter-rouge"><div class="highlight"><pre class="highlight"><code>&gt; clrthreads
ThreadCount:      6
UnstartedThread:  0
BackgroundThread: 5
PendingThread:    0
DeadThread:       0
Hosted Runtime:   no

 DBG   ID     OSID ThreadOBJ           State GC Mode     GC Alloc Context     Domain           Lock Count  Apt Exception
   0    1     b63a 000055D119475610  2020020 Preemptive  ...                  000055D11944C600 -00001 Ukn
   5    2     b640 000055D119477D00    21220 Preemptive  ...                  000055D11944C600 -00001 Ukn (Finalizer)
   6    3     b641 000055D119480860    21220 Preemptive  ...                  000055D11944C600 -00001 Ukn
   8    4     b643 000055D1194CF160  2021220 Preemptive  ...                  000055D11944C600 -00001 Ukn
   9    5     b644 000055D1194DC6D0  2021220 Preemptive  ...                  000055D11944C600 -00001 Ukn
  10    6     b645 000055D1194DDDB0  2021220 Preemptive  ...                  000055D11944C600 -00001 Ukn
</code></pre></div></div>

<p><code class="language-plaintext highlighter-rouge">clrstack -all</code> dumps the managed stack of every thread at once. This is usually the first thing
I look at — it tells you what the whole process was doing:</p>

<div class="language-text highlighter-rouge"><div class="highlight"><pre class="highlight"><code>&gt; clrstack -all
...excerpt
OS Thread Id: 0xb643
        Child SP               IP Call Site
00007F8048DFD990 ... System.Threading.Monitor.Wait(System.Object, Int32)
00007F8048DFDA40 ... System.Threading.ManualResetEventSlim.Wait(Int32, System.Threading.CancellationToken)
00007F8048DFDAB0 ... System.Threading.ManualResetEventSlim.Wait()
00007F8048DFDAC0 ... SosDemo.Program.AcceptConnections()          [Program.cs @ 157]
00007F8048DFDAD0 ... SosDemo.Program.HttpListenerLoop()           [Program.cs @ 156]
00007F8048DFDAE0 ... System.Threading.Thread.StartCallback()
</code></pre></div></div>

<p>To dig into one thread, switch to it and print its stack:</p>

<div class="language-text highlighter-rouge"><div class="highlight"><pre class="highlight"><code>&gt; setthread 8
&gt; clrstack
</code></pre></div></div>

<h2 id="lock-contention">Lock contention</h2>

<p>Symptom: requests hang, CPU is idle, one resource is a bottleneck. <code class="language-plaintext highlighter-rouge">syncblk</code> lists every
<a href="https://learn.microsoft.com/en-us/dotnet/core/diagnostics/sos-debugging-extension">SyncBlock</a>
that backs a CLR monitor (<code class="language-plaintext highlighter-rouge">lock</code> / <code class="language-plaintext highlighter-rouge">Monitor.Enter</code>) which is currently <strong>held</strong>:</p>

<div class="language-text highlighter-rouge"><div class="highlight"><pre class="highlight"><code>&gt; syncblk
Index         SyncBlock MonitorHeld Recursion Owning Thread Info          SyncBlock Owner
    1 00007F8230001958            7         1 00005650149D9220 b6e9   8   00007f827140c3d0 System.Object
-----------------------------
Total           1
</code></pre></div></div>

<p>Read it as: the monitor on object <code class="language-plaintext highlighter-rouge">00007f827140c3d0</code> is owned by thread <strong>b6e9</strong> (DBG id <strong>8</strong>).
<code class="language-plaintext highlighter-rouge">MonitorHeld</code> is <code class="language-plaintext highlighter-rouge">2 * waiters + 1</code> when the lock is taken, so <code class="language-plaintext highlighter-rouge">7</code> means <strong>three</strong> threads are
queued behind the owner.</p>

<p><code class="language-plaintext highlighter-rouge">pstacks</code> groups threads by identical stack, which makes the contention obvious at a glance —
one thread sleeps while holding the lock, three sit in <code class="language-plaintext highlighter-rouge">Monitor.Enter</code>:</p>

<div class="language-text highlighter-rouge"><div class="highlight"><pre class="highlight"><code>&gt; pstacks
...excerpt
      ~~~~ b6e9
         1 System.Threading.Thread.Sleep(Int32)
         1 SosDemo.Program+&lt;&gt;c.&lt;LockContention&gt;b__4_0()
      ~~~~ b6ed,b6ee,b6ef
         3 System.Threading.Monitor.Enter_Slowpath(Object)
         3 System.Threading.Monitor.Enter(Object, Boolean ByRef)
         3 SosDemo.Program.ChargeCustomer(Int32)

==&gt; 5 threads with 2 roots
</code></pre></div></div>

<p>Now switch to the owner and find out <strong>why</strong> it is holding the lock for so long:</p>

<div class="language-text highlighter-rouge"><div class="highlight"><pre class="highlight"><code>&gt; setthread 8
&gt; clrstack
        Child SP               IP Call Site
00007F8243FFEA10 ... System.Threading.Thread.Sleep(Int32)
00007F8243FFEAB0 ... SosDemo.Program+&lt;&gt;c.&lt;LockContention&gt;b__4_0()   [Program.cs @ 37]
00007F8243FFEAE0 ... System.Threading.Thread.StartCallback()
</code></pre></div></div>

<h2 id="deadlocks">Deadlocks</h2>

<p>A deadlock is just lock contention with a cycle. Here <code class="language-plaintext highlighter-rouge">syncblk</code> shows <strong>two</strong> held monitors:</p>

<div class="language-text highlighter-rouge"><div class="highlight"><pre class="highlight"><code>&gt; syncblk
Index         SyncBlock MonitorHeld Recursion Owning Thread Info          SyncBlock Owner
    1 00007FE550002578            3         1 000055C97DAC47C0 b70f   9   00007fe58940c3e8 System.Object
    2 00007FE5500025D0            3         1 000055C97DAB6970 b70e   8   00007fe58940c3d0 System.Object
</code></pre></div></div>

<p>Thread <strong>8</strong> owns object <code class="language-plaintext highlighter-rouge">...c3d0</code>, thread <strong>9</strong> owns object <code class="language-plaintext highlighter-rouge">...c3e8</code>, and <code class="language-plaintext highlighter-rouge">MonitorHeld == 3</code>
means one waiter on each. To see <em>which</em> lock each thread is blocked on, print the stack with
arguments and locals (<code class="language-plaintext highlighter-rouge">clrstack -a</code>). The <code class="language-plaintext highlighter-rouge">obj</code> parameter of <code class="language-plaintext highlighter-rouge">Monitor.Enter</code> is optimised away,
but the C# locals still hold the object references:</p>

<div class="language-text highlighter-rouge"><div class="highlight"><pre class="highlight"><code>&gt; setthread 8
&gt; clrstack -a
...excerpt
00007FE55BFFEA80 ... System.Threading.Monitor.Enter(System.Object, Boolean ByRef)
00007FE55BFFEAA0 ... SosDemo.Program+&lt;&gt;c.&lt;Deadlock&gt;b__6_0()   [Program.cs @ 70]
    LOCALS:
        0x00007FE55BFFEAC0 = 0x00007fe58940c3d0     &lt;- holds this one (SyncBlock 2)
        0x00007FE55BFFEAB0 = 0x00007fe58940c3e8     &lt;- waiting for this one (SyncBlock 1, owned by thread 9)

&gt; setthread 9
&gt; clrstack -a
...excerpt
00007FE55B7FDAA0 ... SosDemo.Program+&lt;&gt;c.&lt;Deadlock&gt;b__6_1()   [Program.cs @ 79]
    LOCALS:
        0x00007FE55B7FDAC0 = 0x00007fe58940c3e8     &lt;- holds this one (SyncBlock 1)
        0x00007FE55B7FDAB0 = 0x00007fe58940c3d0     &lt;- waiting for this one (SyncBlock 2, owned by thread 8)
</code></pre></div></div>

<p>Thread 8 waits for a lock thread 9 owns, thread 9 waits for a lock thread 8 owns — the cycle is
the deadlock.</p>

<h2 id="exception-analysis-crash-dumps">Exception analysis (crash dumps)</h2>

<p>With <code class="language-plaintext highlighter-rouge">DOTNET_DbgEnableMiniDump=1</code> the dump is taken on the unhandled exception. <code class="language-plaintext highlighter-rouge">clrthreads</code>
immediately points at the faulting thread — note the <code class="language-plaintext highlighter-rouge">Exception</code> column:</p>

<div class="language-text highlighter-rouge"><div class="highlight"><pre class="highlight"><code>&gt; clrthreads
...excerpt
 DBG   ID     OSID ThreadOBJ           State GC Mode     ...  Exception
   8    4     b7d0 000055EF9571ADE0    21020 Cooperative ...  System.InvalidOperationException 00007f2de940c9b8 (nested exceptions)
</code></pre></div></div>

<p>Switch to it and use <code class="language-plaintext highlighter-rouge">pe -nested</code> (print exception, including inner exceptions). This gives you
the full chain with managed stack traces — usually everything you need:</p>

<div class="language-text highlighter-rouge"><div class="highlight"><pre class="highlight"><code>&gt; setthread 8
&gt; pe -nested
Exception object: 00007f2de940c9b8
Exception type:   System.InvalidOperationException
Message:          Report generation failed for account 42
InnerException:   System.Collections.Generic.KeyNotFoundException, Use printexception 00007F2DE940C890 to see more.
StackTrace (generated):
    SP               IP               Function
    00007F2DC13F9E90 00007F3D7CE92BED SosDemo.dll!SosDemo.Program.RunReport()+0x8d
    00007F2DC13FDAE0 00007F3D7C0A9B65 System.Private.CoreLib.dll!System.Threading.Thread.StartCallback()+0x85
HResult: 80131509

Nested exception -------------------------------------------------------------
Exception object: 00007f2de940c890
Exception type:   System.Collections.Generic.KeyNotFoundException
Message:          Account 42 is not in the cache
StackTrace (generated):
    SP               IP               Function
    00007F2DC13FDA50 00007F3D7CE92CE9 SosDemo.dll!SosDemo.Program.LoadAccount(Int32)+0xd9
    00007F2DC13FDAB0 00007F3D7CE92B8E SosDemo.dll!SosDemo.Program.RunReport()+0x2e
HResult: 80131577
</code></pre></div></div>

<p><code class="language-plaintext highlighter-rouge">dso</code> (dump stack objects) walks the raw stack memory and lists every object reference it finds —
handy when the exception has already been caught-and-rethrown and <code class="language-plaintext highlighter-rouge">pe</code> on the current frame comes
up empty:</p>

<div class="language-text highlighter-rouge"><div class="highlight"><pre class="highlight"><code>&gt; setthread 8
&gt; dso
          SP/REG           Object Name
    7f2dc13f6478     7f2de940c9b8 System.InvalidOperationException
    7f2dc13f6808     7f2de940c890 System.Collections.Generic.KeyNotFoundException
    ...excerpt
</code></pre></div></div>

<h2 id="finalizer-queue">Finalizer queue</h2>

<p>Symptom: memory grows slowly, <code class="language-plaintext highlighter-rouge">~Finalize</code> / <code class="language-plaintext highlighter-rouge">Dispose(false)</code> code seems to never run, or
<code class="language-plaintext highlighter-rouge">SafeHandle</code>s pile up. <code class="language-plaintext highlighter-rouge">finalizequeue</code> shows the state of the finalizable objects:</p>

<div class="language-text highlighter-rouge"><div class="highlight"><pre class="highlight"><code>&gt; finalizequeue
...
Heap 0
generation 0 has 0 objects
generation 1 has 24 objects
generation 2 has 0 objects
Ready for finalization 20,001 objects (55c0215edbb0-&gt;55c021614cb8)
------------------------------
Statistics:
          MT  Count TotalSize Class Name
...
7f4010518e20 20,000   480,000 SosDemo.PendingHandle
Total 20,025 objects, 481,872 bytes
</code></pre></div></div>

<p><strong>“Ready for finalization”</strong> is the backlog: objects that are unreachable, have a finalizer, and
are waiting for the finalizer thread. 20,000 stuck objects means the finalizer thread is not
keeping up — or not running at all. Check it in <code class="language-plaintext highlighter-rouge">clrthreads</code> (it is the one marked
<code class="language-plaintext highlighter-rouge">(Finalizer)</code>) and print its stack:</p>

<div class="language-text highlighter-rouge"><div class="highlight"><pre class="highlight"><code>&gt; setthread 5
&gt; clrstack
        Child SP               IP Call Site
00007F400D11C750 ... System.Threading.Thread.Sleep(Int32)
00007F400D11C7F0 ... SosDemo.StuckFinalizer.Finalize()          [Program.cs @ 166]
00007F400D11C810 ... System.GC.RunFinalizers()
</code></pre></div></div>

<p>There it is: one badly-behaved finalizer blocks the single finalizer thread, so <strong>every</strong> other
finalizer behind it — and everything those objects keep alive — leaks. <code class="language-plaintext highlighter-rouge">gcroot</code> on one of the
stuck objects confirms it is held only by the queue:</p>

<div class="language-text highlighter-rouge"><div class="highlight"><pre class="highlight"><code>&gt; gcroot 7f307cc02048
Finalizer Queue:
    000055c0215edbb8 (finalizer root)
          -&gt; 7f307cc02048     SosDemo.PendingHandle

Found 1 unique roots.
</code></pre></div></div>

<h2 id="runtime-info">Runtime info</h2>

<p>Quick orientation commands when you open an unfamiliar dump:</p>

<div class="language-text highlighter-rouge"><div class="highlight"><pre class="highlight"><code>&gt; eeversion
10.0.926.27113
Workstation mode
SOS Version: 10.0.14.31102

&gt; clrmodules          # loaded managed assemblies
&gt; dumpdomain          # AppDomain(s) and their assemblies
&gt; eeheap -gc          # GC heap size per generation
</code></pre></div></div>

<p>For a deeper look at the GC heap itself (leak hunting, retention paths, <code class="language-plaintext highlighter-rouge">objsize</code>), see the
<a href="/2023/10/03/dotnet-memory-analysis-linux.html">.NET Memory Analysis with Linux</a> post. And when
you need to mix managed and native frames in the same session, that post also shows how to load
SOS into <a href="https://lldb.llvm.org/">LLDB</a>.</p>

<p>The full list of SOS commands is in the
<a href="https://learn.microsoft.com/en-us/dotnet/core/diagnostics/sos-debugging-extension#commands">official documentation</a>,
or type <code class="language-plaintext highlighter-rouge">help</code> at the <code class="language-plaintext highlighter-rouge">dotnet dump</code> prompt.</p>]]></content><author><name>Stefan Geiger</name></author><category term=".NET" /><category term="Linux" /><category term="C#" /><category term="Debugging" /><category term="WinDbg" /><summary type="html"><![CDATA[A few years ago I wrote a WinDbg Cheat Sheet for .NET Developers and later a walkthrough of .NET Memory Analysis with Linux. The memory post covers the “the heap keeps growing” case in detail: dumpheap, dumpobj, objsize, gcroot, dotnet-counters and dotnet-gcdump.]]></summary></entry><entry><title type="html">Boosting Windows 11 with WSL on Proxmox</title><link href="https://www.stefangeiger.ch/2025/12/14/proxmox-win11-wsl.html" rel="alternate" type="text/html" title="Boosting Windows 11 with WSL on Proxmox" /><published>2025-12-14T00:00:00+00:00</published><updated>2025-12-14T00:00:00+00:00</updated><id>https://www.stefangeiger.ch/2025/12/14/proxmox-win11-wsl</id><content type="html" xml:base="https://www.stefangeiger.ch/2025/12/14/proxmox-win11-wsl.html"><![CDATA[<p>In my home lab, I rely on <a href="https://www.proxmox.com">Proxmox</a> as my virtualization platform and run it on a powerful AMD Ryzen 9 9950X CPU with 16 cores and a total of 96 GB of RAM.
This hardware base offers more than enough reserves to run multiple virtual machines in parallel and cover even more demanding workloads.</p>

<p>For my Windows 11 VM, I deliberately set the CPU type to <a href="https://pve.proxmox.com/pve-docs/chapter-qm.html#_qemu_cpu_types"><strong>x86-64-v4</strong></a> or, alternatively, <a href="https://pve.proxmox.com/pve-docs/chapter-qm.html#_qemu_cpu_types"><strong>x86-64-v2-AES</strong></a> in the Proxmox configuration.</p>

<p>In combination with the latest hardware, this setting ensures that Windows runs very close to its native performance.</p>

<p><img src="/assets/images/pve-win11-cpu.png" alt="win11" /></p>

<p>Another important component is the appropriate <a href="https://pve.proxmox.com/wiki/Windows_VirtIO_Drivers">Windows VirtIO drivers</a>. These drivers enable the virtual machine to reach its full potential. Thanks to this configuration, the Windows 11 VM is ideal for development work.</p>

<p>Tools such as Visual Studio run reasonably smoothly, and even larger projects can be edited without noticeable delays.</p>

<p>For a quick overview of system performance, simple benchmarks can be performed in Windows using the <a href="https://learn.microsoft.com/en-us/previous-versions/windows/it-pro/windows-server-2012-r2-and-2012/cc770542(v=ws.11)">Winsat (Windows System Assessment Tool)</a> to evaluate the performance of the VM.</p>

<p>Here is an example with the CPU configuration shown above and 16GB of RAM.</p>

<div class="language-sh highlighter-rouge"><div class="highlight"><pre class="highlight"><code>winsat disk

<span class="o">&gt;</span> Disk  Random 16.0 Read                       826.33 MB/s          8.6
<span class="o">&gt;</span> Disk  Sequential 64.0 Read                   3317.16 MB/s         9.3
<span class="o">&gt;</span> Disk  Sequential 64.0 Write                  3409.08 MB/s         9.3
</code></pre></div></div>

<p>However, I rely on Docker for software development, as many of the projects are container-based. To use Docker effectively and efficiently on Windows, the Windows Subsystem for Linux (WSL) is indispensable.</p>

<h2 id="setup-wsl-and-docker-desktop">Setup WSL and Docker Desktop</h2>

<p><a href="https://learn.microsoft.com/en-us/windows/wsl/install">Installing WSL</a> is very simple. Open a new terminal as administrator and execute the following command</p>

<div class="language-sh highlighter-rouge"><div class="highlight"><pre class="highlight"><code>wsl <span class="nt">--install</span>
</code></pre></div></div>

<p>After successfully installing WSL, you must first restart the virtual machine so that all changes are applied correctly and the necessary system components become active.  Only then can <a href="https://www.docker.com/products/docker-desktop/">Docker Desktop</a> be installed within the Windows VM.</p>

<p>After the second restart, everything seems to be ready: the virtual machine starts up cleanly, Docker Desktop opens, and the next logical step would be to start the actual container development. However, this is precisely where an unexpected problem arises.</p>

<p>Docker cannot be started in this configuration. The reason for this is the CPU emulation used: The configured CPU type <strong>x86-64-v4</strong> does not provide hardware virtualization for the Windows VM.</p>

<p><img src="/assets/images/pve-win11-docker.png" alt="docker" /></p>

<p>In order for Docker to actually run within the Windows VM, an adjustment must be made in the Proxmox configuration.</p>

<p>The previously used CPU type <a href="https://qemu-project.gitlab.io/qemu/system/qemu-cpu-models.html#abi-compatibility-levels-for-cpu-models"><strong>x86-64-v4</strong></a> must be changed to <a href="https://www.qemu.org/docs/master/system/qemu-cpu-models.html"><strong>host</strong></a>.</p>

<p>After restarting, you can also check directly in Windows to see that virtualization is now available correctly. In <strong>Task Manager</strong>, under <strong>Performance</strong>, it is explicitly displayed that virtualization is active.</p>

<p><img src="/assets/images/pve-win11-docker2.png" alt="docker2" /></p>

<p>However, another look at the performance measurements with <strong>Winsat</strong> reveals an unpleasant finding:</p>

<p>The results for read and write operations are now significantly worse than before. This drop in performance is particularly noticeable in I/O-heavy workflows 🫩.</p>

<div class="language-sh highlighter-rouge"><div class="highlight"><pre class="highlight"><code>winsat disk

<span class="o">&gt;</span> Disk  Random 16.0 Read                       144.87 MB/s          7.4
<span class="o">&gt;</span> Disk  Sequential 64.0 Read                   641.51 MB/s          8.2
<span class="o">&gt;</span> Disk  Sequential 64.0 Write                  1151.43 MB/s         8.5
</code></pre></div></div>

<p>This is obviously bad if you have to work with Visual Studio or Rider.</p>

<h2 id="fix-cpu-config">Fix CPU Config</h2>

<p>After some experimentation and help from my “AI friends” and Google, I finally came across an optimized Proxmox configuration that supports both Docker and Windows in the VM with high performance. The key settings are as follows:</p>

<div class="language-sh highlighter-rouge"><div class="highlight"><pre class="highlight"><code>args: <span class="nt">-cpu</span> host,svm,aes,pcid,spec-ctrl,hv_relaxed,hv_vapic,hv_vpindex,hv_time,hv_synic,hv_stimer,hv_reenlightenment,hv_frequencies
cpu: host
</code></pre></div></div>

<p>A new <strong>WinSAT</strong> test now shows significantly improved values 🍻</p>

<div class="language-sh highlighter-rouge"><div class="highlight"><pre class="highlight"><code>winsat disk

<span class="o">&gt;</span> Disk  Random 16.0 Read                       769.59 MB/s           8.6
<span class="o">&gt;</span> Disk  Sequential 64.0 Read                   3841.00 MB/s          9.4
<span class="o">&gt;</span> Disk  Sequential 64.0 Write                  2294.82 MB/s          9.1
</code></pre></div></div>

<p>To implement the optimization described above, the configuration of the corresponding VM in Proxmox must be adjusted. This can be done directly via the command line: <code class="language-plaintext highlighter-rouge">nano /etc/pve/qemu-server/100.conf</code>.</p>

<div class="language-sh highlighter-rouge"><div class="highlight"><pre class="highlight"><code>agent: 1
args: <span class="nt">-cpu</span> host,svm,aes,pcid,spec-ctrl,hv_relaxed,hv_vapic,hv_vpindex,hv_time,hv_synic,hv_stimer,hv_reenlightenment,hv_frequencies
cpu: host
balloon: 0
bios: ovmf
boot: <span class="nv">order</span><span class="o">=</span>scsi0<span class="p">;</span>net0
cores: 20
efidisk0: local-workloads:vm-100-disk-0,efitype<span class="o">=</span>4m,ms-cert<span class="o">=</span>2023,pre-enrolled-keys<span class="o">=</span>1,size<span class="o">=</span>4M
machine: pc-q35-10.1
memory: 16000
meta: creation-qemu<span class="o">=</span>10.1.2,ctime<span class="o">=</span>1765131411
name: win11-test
net0: <span class="nv">virtio</span><span class="o">=</span>BC:24:11:29:E5:C5,bridge<span class="o">=</span>vmbr0,firewall<span class="o">=</span>1,tag<span class="o">=</span>10
numa: 1
ostype: win11
scsi0: local-workloads:vm-100-disk-2,aio<span class="o">=</span>threads,cache<span class="o">=</span>writeback,iothread<span class="o">=</span>1,size<span class="o">=</span>50G
scsihw: virtio-scsi-single
smbios1: <span class="nv">uuid</span><span class="o">=</span>fefa54d2-0c4b-44ad-ac8e-79045ccd362c
sockets: 1
tpmstate0: local-workloads:vm-100-disk-1,size<span class="o">=</span>4M,version<span class="o">=</span>v2.0
vga: qxl
vmgenid: a81bf0f1-ad54-4df4-a7ea-6b61fff8f2ae
</code></pre></div></div>

<p>Further information on CPU flags and types:</p>
<ul>
  <li><a href="https://www.qemu.org/docs/master/system/i386/hyperv.html">https://www.qemu.org/docs/master/system/i386/hyperv.html</a></li>
  <li><a href="https://qemu-project.gitlab.io/qemu/system/qemu-cpu-models.html">https://qemu-project.gitlab.io/qemu/system/qemu-cpu-models.html</a></li>
</ul>]]></content><author><name>Stefan Geiger</name></author><category term="Proxmox" /><category term="Linux" /><category term="Windows" /><category term="Homelab" /><summary type="html"><![CDATA[In my home lab, I rely on Proxmox as my virtualization platform and run it on a powerful AMD Ryzen 9 9950X CPU with 16 cores and a total of 96 GB of RAM. This hardware base offers more than enough reserves to run multiple virtual machines in parallel and cover even more demanding workloads.]]></summary></entry><entry><title type="html">Setup JetBrains Rider in a Container</title><link href="https://www.stefangeiger.ch/2023/12/10/rider-distrobox.html" rel="alternate" type="text/html" title="Setup JetBrains Rider in a Container" /><published>2023-12-10T00:00:00+00:00</published><updated>2023-12-10T00:00:00+00:00</updated><id>https://www.stefangeiger.ch/2023/12/10/rider-distrobox</id><content type="html" xml:base="https://www.stefangeiger.ch/2023/12/10/rider-distrobox.html"><![CDATA[<p>I’ve been playing around with <a href="https://fedoraproject.org/silverblue/">Fedora Silverblue</a> for a while now.
I find the concept of <a href="https://www.howtogeek.com/what-is-an-immutable-linux-distro/">immutable distributions</a> extremely interesting, even if it still has a few problems.
As soon as you deal with immutable distributions, you can’t get around <a href="https://docs.fedoraproject.org/en-US/fedora-silverblue/toolbox/">Toolbox</a> or <a href="https://github.com/89luca89/distrobox">Distrobox</a>, whereby <a href="https://github.com/89luca89/distrobox">Distrobox</a> is clearly ahead in my opinion.</p>

<p>The <a href="https://distrobox.it/">distrobox</a> documentation describes the project with:</p>

<blockquote>
  <p>Use any Linux distribution inside your terminal. Enable both backward and forward compatibility with software and freedom to use whatever distribution you’re more comfortable with. Distrobox uses podman, docker or lilipod to create containers using the Linux distribution of your choice. The created container will be tightly integrated with the host, allowing sharing of the HOME directory of the user, external storage, external USB devices and graphical apps (X11/Wayland), and audio.
<strong>https://distrobox.it/</strong></p>
</blockquote>

<p>Here is a short guide on how to create an isolated development environment for <a href="https://learn.microsoft.com/en-us/dotnet/core/whats-new/dotnet-8">.NET 8.0</a> within a few minutes, including the latest <a href="https://www.jetbrains.com/rider/">JetBrains Rider 2023.3</a>.</p>

<p>The development container runs with the current <a href="https://www.debian.org/">Debian 12</a> image. As host environment I use <a href="https://fedoraproject.org/">Fedora 38</a> or <a href="https://fedoraproject.org/silverblue/">Fedora 39 Silverblue</a>. Of course, any distribution supported by <a href="https://github.com/89luca89/distrobox">Distrobox</a> can be used.</p>

<h2 id="create-the-development-container">Create the Development Container</h2>

<p>In a first step, we create the container for the .NET development environment with the help of <a href="https://distrobox.it/usage/distrobox-create/">distrobox create</a>.</p>

<div class="language-bash highlighter-rouge"><div class="highlight"><pre class="highlight"><code>distrobox create <span class="nt">-i</span> debian <span class="nt">-n</span> debian <span class="nt">--home</span> ~/.distrobox/debian
</code></pre></div></div>

<p>With <a href="https://distrobox.it/usage/distrobox-enter/">distrobox enter</a> we now “jump” into the container so that all further instructions are executed in the container.</p>

<div class="language-bash highlighter-rouge"><div class="highlight"><pre class="highlight"><code>distrobox enter debian
</code></pre></div></div>

<h2 id="setup-net-80">Setup .NET 8.0</h2>

<p>The installation of <a href="https://dotnet.microsoft.com/en-us/download/dotnet/8.0">.NET 8.0</a> under Debian is simple. You only need the official package repositories.</p>

<div class="language-bash highlighter-rouge"><div class="highlight"><pre class="highlight"><code>wget https://packages.microsoft.com/config/debian/12/packages-microsoft-prod.deb <span class="nt">-O</span> packages-microsoft-prod.deb
<span class="nb">sudo </span>dpkg <span class="nt">-i</span> packages-microsoft-prod.deb
</code></pre></div></div>

<p>The entire .NET 8.0 SDK can now be easily installed with <strong>apt</strong>.</p>

<div class="language-bash highlighter-rouge"><div class="highlight"><pre class="highlight"><code><span class="nb">sudo </span>apt update <span class="o">&amp;&amp;</span> <span class="nb">sudo </span>apt <span class="nb">install </span>dotnet-sdk-8.0
</code></pre></div></div>

<p>The necessary steps are explained in detail in the <a href="https://learn.microsoft.com/en-us/dotnet/core/install/linux-debian">official Microsoft documentation</a>.</p>

<h2 id="install-jetbrains-rider-20233">Install JetBrains Rider 2023.3</h2>

<p>For <a href="https://www.jetbrains.com/rider/">Rider</a> to run smoothly, we need a few more libraries and of course <a href="https://git-scm.com/download/linux">git</a>.</p>

<div class="language-bash highlighter-rouge"><div class="highlight"><pre class="highlight"><code><span class="nb">sudo </span>apt <span class="nb">install </span>git libxtst6 libglib2.0-bin
</code></pre></div></div>

<p>Finally, all you need to do is download and unzip Rider.</p>

<div class="language-bash highlighter-rouge"><div class="highlight"><pre class="highlight"><code>wget https://download.jetbrains.com/rider/JetBrains.Rider-2023.3.tar.gz
<span class="nb">tar </span>xfvz JetBrains.Rider-2023.3.tar.gz
</code></pre></div></div>

<p>And you’re ready to start .NET development in a completely isolated environment 🍺</p>

<div class="language-bash highlighter-rouge"><div class="highlight"><pre class="highlight"><code><span class="nb">cd</span> <span class="s1">'JetBrains\ Rider-2023.3/bin'</span>
./rider.sh
</code></pre></div></div>]]></content><author><name>Stefan Geiger</name></author><category term=".NET" /><category term="Linux" /><category term="Distrobox" /><category term="C#" /><category term="JetBrains" /><category term="Rider" /><summary type="html"><![CDATA[I’ve been playing around with Fedora Silverblue for a while now. I find the concept of immutable distributions extremely interesting, even if it still has a few problems. As soon as you deal with immutable distributions, you can’t get around Toolbox or Distrobox, whereby Distrobox is clearly ahead in my opinion.]]></summary></entry><entry><title type="html">.NET Memory Analysis with Linux</title><link href="https://www.stefangeiger.ch/2023/10/03/dotnet-memory-analysis-linux.html" rel="alternate" type="text/html" title=".NET Memory Analysis with Linux" /><published>2023-10-03T00:00:00+00:00</published><updated>2023-10-03T00:00:00+00:00</updated><id>https://www.stefangeiger.ch/2023/10/03/dotnet-memory-analysis-linux</id><content type="html" xml:base="https://www.stefangeiger.ch/2023/10/03/dotnet-memory-analysis-linux.html"><![CDATA[<p>For Windows, there are various programs and tools for the analysis of memory/performance problems of .NET programs.
These include the “official” programs from Microsoft such as <a href="https://github.com/microsoft/perfview">Perfview</a>, <a href="https://visualstudio.microsoft.com">Visual Studio</a> or <a href="https://apps.microsoft.com/store/detail/windbg-preview/9PGJGD53TN86?hl=en-us&amp;gl=us">WinDBG</a>.</p>

<p>Under Linux, the choice is unfortunately very limited.
Fortunately, Microsoft provides a whole set of tools for analyzing memory/performance problems of .NET programs with the <a href="https://learn.microsoft.com/en-us/dotnet/core/diagnostics/">dotnet diagnostic tools</a>.
These work under Linux as well as in Windows and with restrictions also under macOS.</p>

<h2 id="dotnet-counters">dotnet-counters</h2>

<p>The first step is to find out if there really is a problem with the managed memory (GC Heap).</p>

<p>This is easily done with <a href="https://learn.microsoft.com/en-us/dotnet/core/diagnostics/dotnet-counters">dotnet counters</a>.
With the help of <strong>dotnet counters monitor -p &lt;PROCESS ID&gt;</strong> monitoring can be activated for any .NET process.</p>

<div class="language-sh highlighter-rouge"><div class="highlight"><pre class="highlight"><code>dotnet counters monitor <span class="nt">-p</span> 1234

Press p to pause, r to resume, q to quit.
    Status: Running

<span class="o">[</span>System.Runtime]
    % Time <span class="k">in </span>GC since last GC <span class="o">(</span>%<span class="o">)</span>                                         0
    Allocation Rate <span class="o">(</span>B / 1 sec<span class="o">)</span>                                        8,168
    CPU Usage <span class="o">(</span>%<span class="o">)</span>                                                          0.007
    Exception Count <span class="o">(</span>Count / 1 sec<span class="o">)</span>                                        0
    GC Committed Bytes <span class="o">(</span>MB<span class="o">)</span>                                              321.516
    GC Fragmentation <span class="o">(</span>%<span class="o">)</span>                                                   0.046
    GC Heap Size <span class="o">(</span>MB<span class="o">)</span>                                                  1,074.347
</code></pre></div></div>

<p>Watch for <strong>GC Heap Size (MB)</strong>. If the value is always increasing but never decreasing, then the application has a memory leak.</p>

<h2 id="dotnet-gcdump">dotnet-gcdump</h2>

<p>A simple overview of all objects managed by the garbage collector (GC) can be displayed with <a href="https://learn.microsoft.com/en-us/dotnet/core/diagnostics/dotnet-gcdump"><strong>dotnet gcdump</strong></a>.
To do this, first create a memory dump of the desired .NET process with <a href="https://learn.microsoft.com/en-us/dotnet/core/diagnostics/dotnet-gcdump#dotnet-gcdump-collect"><strong>dotnet gcdump collect -p &lt;PROCESS ID&gt;</strong></a>.</p>

<div class="language-sh highlighter-rouge"><div class="highlight"><pre class="highlight"><code>dotnet gcdump collect <span class="nt">-p</span> 1234
</code></pre></div></div>

<p>The managed objects can now be viewed with <a href="https://learn.microsoft.com/en-us/dotnet/core/diagnostics/dotnet-gcdump#dotnet-gcdump-report-gcdump_filename"><strong>dotnet gcdump report &lt;DUMP FILE&gt;</strong></a>.</p>

<div class="language-sh highlighter-rouge"><div class="highlight"><pre class="highlight"><code>dotnet gcdump report 20230906_205437_23141.gcdump

  1,283,668,344  GC Heap bytes
          4,315  GC Heap objects

   Object Bytes     Count  Type
      1,048,600     1,224  System.Byte[] <span class="o">(</span>Bytes <span class="o">&gt;</span> 1M<span class="o">)</span>  <span class="o">[</span>System.Private.CoreLib.dll]
         28,588         1  System.String <span class="o">(</span>Bytes <span class="o">&gt;</span> 10K<span class="o">)</span>  <span class="o">[</span>System.Private.CoreLib.dll]
         16,408         1  MemoryLeak.Lib.LeakData[] <span class="o">(</span>Bytes <span class="o">&gt;</span> 10K<span class="o">)</span>  <span class="o">[</span>MemoryLeak.Lib.dll]
         16,344         1  System.Object[] <span class="o">(</span>Bytes <span class="o">&gt;</span> 10K<span class="o">)</span>  <span class="o">[</span>System.Private.CoreLib.dll]
          8,184         4  System.Object[] <span class="o">(</span>Bytes <span class="o">&gt;</span> 1K<span class="o">)</span>  <span class="o">[</span>System.Private.CoreLib.dll]
</code></pre></div></div>

<p>The report now shows a list of all objects including their size. The output is about the same as <a href="https://learn.microsoft.com/en-us/dotnet/core/diagnostics/sos-debugging-extension"><strong>dumpheap -stat</strong> from the SOS debugging extension</a>.</p>

<p>At the moment, more information cannot be displayed with <strong>dotnet gcdump report</strong>. For memory dumps created with <strong>dotnet gcdump</strong>, the only convenient way at the moment is under Windows with the help of <a href="https://github.com/microsoft/perfview">Perfview</a> or <a href="https://devblogs.microsoft.com/dotnet/collecting-and-analyzing-memory-dumps/#analyzing-gc-dumps-in-visual-studio">Visual Studio</a>.</p>

<h2 id="dotnet-dump">dotnet-dump</h2>

<p><a href="https://learn.microsoft.com/en-us/dotnet/core/diagnostics/dotnet-dump"><strong>dotnet-dump</strong></a> is the most comprehensive tool for memory analysis of .NET applications.
The tool can create memory dumps of .NET processes and provides a virtual environment for analyzing these dumps.</p>

<p>A memory dump of any .NET process is done with <a href="https://learn.microsoft.com/en-us/dotnet/core/diagnostics/dotnet-dump#dotnet-dump-collect"><strong>dotnet dump collect -p &lt;PROCESS ID&gt;</strong></a></p>

<div class="language-sh highlighter-rouge"><div class="highlight"><pre class="highlight"><code>dotnet dump collect <span class="nt">-p</span> 1234
</code></pre></div></div>

<p>For the analysis of the dump a virtual environment is available afterwards which is started with <a href="https://learn.microsoft.com/en-us/dotnet/core/diagnostics/dotnet-dump#dotnet-dump-analyze"><strong>dotnet dump analyse &lt;DUMP FILE&gt;</strong></a> .</p>

<div class="language-sh highlighter-rouge"><div class="highlight"><pre class="highlight"><code>dotnet dump analyze core_20230830_213024
</code></pre></div></div>

<p>The available <a href="https://learn.microsoft.com/en-us/dotnet/core/diagnostics/dotnet-dump#analyze-sos-commands">SOS commands are documented here</a> and can be displayed with the <strong>help</strong> command.</p>

<p>An overview of all objects can be displayed with <strong>dumpheap -stat</strong>. The output is analogous to the <strong>dotnet gcdump report &lt;DUMP FILE&gt;</strong> used above and shows the number of all managed objects as well as their size in memory.</p>

<div class="language-sh highlighter-rouge"><div class="highlight"><pre class="highlight"><code>dumpheap <span class="nt">-stat</span>

Statistics:
          MT Count     TotalSize Class Name
7f230ed2e098    18           984 System.String[]
7f230ed56608     7         3,292 System.Char[]
7f230ec4b9d8    14         4,760 System.Int32[]
7f230ebda508     7        36,016 System.Object[]
7f230f1aba78     3        49,224 MemoryLeak.Lib.LeakData[]
7f230ed01038   408        49,754 System.String
7f230f1aac60 2,200        52,800 MemoryLeak.Lib.LeakData
7f230f1ab2a0 2,200        52,800 MemoryLeak.Lib.Data
56490bf28700 2,280        93,408 Free
</code></pre></div></div>

<p>To get more information about the object of type <strong>MemoryLeak.Lib.Data</strong>, you can use <strong>dumpheap -mt 7f230f1ab2a0</strong> to output each instance. Here in the example there are 2’200 instances of the type <strong>MemoryLeak.Lib.Data</strong></p>

<div class="language-sh highlighter-rouge"><div class="highlight"><pre class="highlight"><code>dumpheap <span class="nt">-mt</span> 7f230f1ab2a0

7ee302816f70     7f230f1ab2a0             24
7ee302816ff0     7f230f1ab2a0             24
7ee302817020     7f230f1ab2a0             24
</code></pre></div></div>

<p>Now that we have an overview of all objects of the <strong>MemoryLeak.Lib.Data</strong> type, we can perform further analysis.
For example, we can display the “content” of the object. For this we take any object from the list and execute <strong>do (dumpobject)</strong>.</p>

<div class="language-sh highlighter-rouge"><div class="highlight"><pre class="highlight"><code><span class="k">do </span>7ee302817020

Name:        MemoryLeak.Lib.Data
MethodTable: 00007f230f1ab2a0
EEClass:     00007f230f17be00
Tracked Type: <span class="nb">false
</span>Size:        24<span class="o">(</span>0x18<span class="o">)</span> bytes
File:        /home/stef/projects/performance/MemoryLeak/bin/Debug/net7.0/MemoryLeak.Lib.dll
Fields:
              MT    Field   Offset                 Type VT     Attr            Value Name
00007f230f01fcd0  400000a        8        System.Byte[]  0 instance 00007ee302e000b0 &lt;Buffer&gt;k__BackingField
</code></pre></div></div>

<p>The object contains only one byte array and is defined as follows:</p>

<div class="language-c# highlighter-rouge"><div class="highlight"><pre class="highlight"><code><span class="k">internal</span> <span class="k">class</span> <span class="nc">Data</span>
<span class="p">{</span>
    <span class="k">public</span> <span class="kt">byte</span><span class="p">[]?</span> <span class="n">Buffer</span> <span class="p">{</span> <span class="k">get</span><span class="p">;</span> <span class="k">set</span><span class="p">;</span> <span class="p">}</span>
<span class="p">}</span>
</code></pre></div></div>

<p>Further we can display the used memory of this object with <strong>objsize</strong>:</p>

<div class="language-sh highlighter-rouge"><div class="highlight"><pre class="highlight"><code>objsize 7ee302817020

Objects which 7ee302817020<span class="o">(</span>MemoryLeak.Lib.Data<span class="o">)</span> transitively keep alive:

         Address               MT           Size
    7ee302817020     7f230f1ab2a0             24
    7ee302e000b0     7f230f01fcd0      1,048,600

Statistics:
          MT Count TotalSize Class Name
7f230f1ab2a0     1        24 MemoryLeak.Lib.Data
7f230f01fcd0     1 1,048,600 System.Byte[]
Total 2 objects, 1,048,624 bytes
</code></pre></div></div>

<p>It happens from time to time that the garbage collector does not free the memory anymore, because an object is still used somehow.
Here <strong>gcroot</strong> helps. With <strong>gcroot</strong> you can see which objects reference a certain object.</p>

<div class="language-sh highlighter-rouge"><div class="highlight"><pre class="highlight"><code>gcroot 7ee302817020

HandleTable:
00007f238af413e8 <span class="o">(</span>strong handle<span class="o">)</span>
-&gt; 7ee300000020 System.Object[]
-&gt; 7ee302816f20 System.Collections.Generic.List&lt;MemoryLeak.Lib.LeakData&gt; <span class="o">(</span>static variable: System.Random._random<span class="o">)</span>
-&gt; 7ee30201e750 MemoryLeak.Lib.LeakData[]
-&gt; 7ee302817008 MemoryLeak.Lib.LeakData
-&gt; 7ee302817020 MemoryLeak.Lib.Data
</code></pre></div></div>

<h2 id="lldb">LLDB</h2>

<p>For the analysis of a memory dump, <a href="https://lldb.llvm.org/"><strong>LLDB</strong></a> can also be used instead of <a href="#dotnet-dump"><strong>dotnet-dump</strong></a>.
The advantage of <a href="https://lldb.llvm.org/"><strong>LLDB</strong></a> is that the analysis of managed and native code is possible.</p>

<p><a href="https://lldb.llvm.org/"><strong>LLDB</strong></a> is probably available in all major linux distributions in the package sources and can be installed with the help of the package manager. Here’s an example of dnf (Fedora):</p>

<div class="language-sh highlighter-rouge"><div class="highlight"><pre class="highlight"><code><span class="nb">sudo </span>dnf <span class="nb">install </span>lldb
</code></pre></div></div>

<p>The memory dump is also generated with <a href="https://learn.microsoft.com/en-us/dotnet/core/diagnostics/dotnet-dump#dotnet-dump-collect"><strong>dotnet dump collect -p &lt;PROCESS ID&gt;</strong></a>.
<a href="https://lldb.llvm.org/"><strong>LLDB</strong></a> uses the <a href="https://learn.microsoft.com/en-us/dotnet/core/diagnostics/sos-debugging-extension">SOS debugging extension</a> to debug managed code.
It may be necessary to install <a href="https://learn.microsoft.com/en-us/dotnet/core/diagnostics/dotnet-sos"><strong>dotnet-sos</strong></a> first so that the <a href="https://learn.microsoft.com/en-us/dotnet/core/diagnostics/sos-debugging-extension">SOS debugging extension</a> is found by <a href="https://lldb.llvm.org/"><strong>LLDB</strong></a>.</p>

<div class="language-sh highlighter-rouge"><div class="highlight"><pre class="highlight"><code>dotnet tool <span class="nb">install</span> <span class="nt">--global</span> dotnet-sos
dotnet sos <span class="nb">install</span>
</code></pre></div></div>

<p>The memory dump can then be loaded into the interactive shell of <a href="https://lldb.llvm.org/"><strong>LLDB</strong></a> with <strong>lldb –core DUMPFILE</strong></p>

<div class="language-sh highlighter-rouge"><div class="highlight"><pre class="highlight"><code>lldb <span class="nt">--core</span> core_20231003_100537

Current symbol store settings:
-&gt; Cache: /home/stef/.dotnet/symbolcache
-&gt; Server: https://msdl.microsoft.com/download/symbols/ Timeout: 4 RetryCount: 0
<span class="o">(</span>lldb<span class="o">)</span> target create <span class="nt">--core</span> <span class="s2">"core_20231003_100537"</span>
Core file <span class="s1">'/home/stef/projects/performance/dumps/core_20231003_100537'</span> <span class="o">(</span>x86_64<span class="o">)</span> was loaded.
<span class="o">(</span>lldb<span class="o">)</span>
</code></pre></div></div>

<p>The memory analysis now works exactly as with <a href="#dotnet-dump"><strong>dotnet dump</strong></a>. All <a href="https://learn.microsoft.com/en-us/dotnet/core/diagnostics/sos-debugging-extension#lldb-example-usage">SOS commands</a> of the <a href="https://learn.microsoft.com/en-us/dotnet/core/diagnostics/sos-debugging-extension">SOS debugging extension</a> are available, like <strong>dumpheap -stat</strong> and so on.</p>

<p>More detailed information for using LLDB can be found in the <a href="https://learn.microsoft.com/en-us/dotnet/core/diagnostics/debug-linux-dumps#analyze-dumps-on-linux">official documentation from Microsoft.</a></p>

<!-- Im weiteren ist es möglich mit [**dotnet symbol**](https://learn.microsoft.com/en-us/dotnet/core/diagnostics/dotnet-symbol) die Symbole, DAC und Module für eine spezifische Version herunterzuladen

```sh
dotnet tool install --global dotnet-symbol
dotnet symbol --host-only --debugging core_20231003_100537
``` -->

<h2 id="dotmemory-with-jetbrains-rider">dotMemory with JetBrains Rider</h2>

<p>Of course, there are also commercial products like <a href="https://www.jetbrains.com/rider/">JetBrains Rider</a> that are available for both Windows and Linux thanks to their platform independence.
Since <a href="https://blog.jetbrains.com/dotnet/2023/08/02/2023-2-dottools-release/">version 2023.2 of Rider</a> you can collect memory dumps and analyze them directly in <a href="https://www.jetbrains.com/rider/">Rider</a>, just like in the standalone version of <a href="https://www.jetbrains.com/dotmemory/">dotMemory</a>.</p>]]></content><author><name>Stefan Geiger</name></author><category term=".NET" /><category term="Linux" /><category term="C#" /><category term="Debugging" /><category term="WinDbg" /><summary type="html"><![CDATA[For Windows, there are various programs and tools for the analysis of memory/performance problems of .NET programs. These include the “official” programs from Microsoft such as Perfview, Visual Studio or WinDBG.]]></summary></entry><entry><title type="html">Capture a network trace with windows</title><link href="https://www.stefangeiger.ch/2023/03/30/windows-network-trace.html" rel="alternate" type="text/html" title="Capture a network trace with windows" /><published>2023-03-30T00:00:00+00:00</published><updated>2023-03-30T00:00:00+00:00</updated><id>https://www.stefangeiger.ch/2023/03/30/windows-network-trace</id><content type="html" xml:base="https://www.stefangeiger.ch/2023/03/30/windows-network-trace.html"><![CDATA[<p>Tools such as <a href="https://www.wireshark.org/">Wireshark</a> or <a href="https://www.tcpdump.org/">tcpdump</a> are often used to analyse network problems. Especially <a href="https://www.tcpdump.org/">tcpdump</a> is pre-installed in most Linux distributions and can be used directly. But what to do in a pure Windows server/client environment ?</p>

<p>The problem is exacerbated in productive environments, where it is usually not possible to simply install additional software.</p>

<p>Fortunately, Windows also offers the possibility of recording network traffic with home remedies. The tool is called <a href="https://learn.microsoft.com/en-us/windows-server/networking/technologies/netsh/netsh">Network Shell</a>, or <strong>netsh</strong> for short, and is able to record network traffic.</p>

<p>The recording can be started in an elevated command prompt as follows:</p>

<div class="language-sh highlighter-rouge"><div class="highlight"><pre class="highlight"><code>netsh trace start <span class="nv">capture</span><span class="o">=</span><span class="nb">yes </span><span class="nv">tracefile</span><span class="o">=</span>C:<span class="se">\c</span>apture.etl <span class="nv">maxsize</span><span class="o">=</span>1000 <span class="nv">filemode</span><span class="o">=</span>circular <span class="nv">overwrite</span><span class="o">=</span><span class="nb">yes </span><span class="nv">report</span><span class="o">=</span>no
</code></pre></div></div>

<p>As soon as enough data has been collected, the trace can be stopped again with the following command:</p>

<div class="language-sh highlighter-rouge"><div class="highlight"><pre class="highlight"><code>netsh trace stop
</code></pre></div></div>

<p>In principle, such a trace <a href="https://learn.microsoft.com/en-us/windows/win32/ndf/using-network-monitor-to-view-etl-files">can be easily analysed</a> with the help of the <a href="https://www.microsoft.com/en-us/download/4865">Network Monitor</a>. Unfortunately, the <a href="https://www.microsoft.com/en-us/download/4865">Network Monitor</a> is no longer being developed. However, the generated ETL file can also be analysed with <a href="https://github.com/microsoft/perfview/">PerfView</a> or the <a href="https://learn.microsoft.com/en-us/windows-hardware/test/wpt/windows-performance-analyzer">Windows Performance Analyzer (WPA)</a>.</p>

<p>In my view, it is easier to analyse network traffic with <a href="https://www.wireshark.org/">Wireshark</a>. Unfortunately, <a href="https://www.wireshark.org/">Wireshark</a> cannot do much with the ETL file.</p>

<p>The remedy is a program published by Microsoft that is able to convert an ETL file into a <a href="https://en.wikipedia.org/wiki/Pcap">PCAP</a> file. The program, called <strong>etl2pcapng.exe</strong>, is open source and can be downloaded from GitHub under the following link:</p>

<p><a href="https://github.com/microsoft/etl2pcapng/">https://github.com/microsoft/etl2pcapng</a></p>

<p>The conversion is very simple:</p>

<div class="language-sh highlighter-rouge"><div class="highlight"><pre class="highlight"><code>etl2pcapng.exe <span class="k">in</span>.etl out.pcapng
</code></pre></div></div>

<p>And already the recorded network traffic can be analysed with the help of <a href="https://www.wireshark.org/">Wireshark</a> 😎.
This article provides <a href="https://techcommunity.microsoft.com/t5/core-infrastructure-and-security/converting-etl-files-to-pcap-files/ba-p/1133297">further information</a>.</p>]]></content><author><name>Stefan Geiger</name></author><category term="Debugging" /><category term="ETL" /><category term="Windows" /><category term="Networking" /><category term="Wireshark" /><category term="tcpdump" /><summary type="html"><![CDATA[Tools such as Wireshark or tcpdump are often used to analyse network problems. Especially tcpdump is pre-installed in most Linux distributions and can be used directly. But what to do in a pure Windows server/client environment ?]]></summary></entry><entry><title type="html">Install .NET 7 in Fedora 37</title><link href="https://www.stefangeiger.ch/2022/12/11/dotnet-7-fedora.html" rel="alternate" type="text/html" title="Install .NET 7 in Fedora 37" /><published>2022-12-11T00:00:00+00:00</published><updated>2022-12-11T00:00:00+00:00</updated><id>https://www.stefangeiger.ch/2022/12/11/dotnet-7-fedora</id><content type="html" xml:base="https://www.stefangeiger.ch/2022/12/11/dotnet-7-fedora.html"><![CDATA[<p>A few weeks ago <a href="https://devblogs.microsoft.com/dotnet/announcing-dotnet-7/">.NET 7</a> was finally released by Microsoft with a lot of new features. Highly recommended is the article around the performance improvements (<a href="https://devblogs.microsoft.com/dotnet/performance_improvements_in_net_7/">Performance Improvements in .NET 7</a>) that have been made compared to .NET 6.0.</p>

<p>This post is not primarily about what new features .NET 7.0 brings, but more about how to install the latest runtime from microsoft on fedora. Unfortunately, only .NET 6.0 can be installed via dnf. .NET 7.0 is still completely missing from the package sources.</p>

<p>The official documentation for .NET 7.0 and fedora only shows the not much meaningful information (<a href="https://learn.microsoft.com/en-us/dotnet/core/install/linux-fedora#supported-distributions">Supported Version</a>):</p>

<blockquote>
  <p>.NET 7 isn’t yet ready for Fedora. This article will be updated when it’s available.</p>
</blockquote>

<p>whatever that means</p>

<p>This article is a kind of continuation of my last article about <a href="/2022/09/08/dotnet-preview-fedora.html">Use .NET 7 with Fedora 36 and Distrobox</a> and describes the installation of <a href="https://dotnet.microsoft.com/en-us/download/dotnet/7.0">.NET 7.0</a> on <a href="https://getfedora.org/">Fedora 37</a>. The same procedure should most likely work for Fedora 36/35 as well.</p>

<h2 id="setup">Setup</h2>

<p>First, head over to the official <a href="https://dotnet.microsoft.com/en-us/download/dotnet/7.0">.NET 7.0 download page</a> and select <strong>dotnet-install scripts</strong>
or use <strong>wget</strong> to download the official <strong>dotnet-install.sh</strong> script.</p>

<div class="language-bash highlighter-rouge"><div class="highlight"><pre class="highlight"><code>wget https://dotnet.microsoft.com/download/dotnet/scripts/v1/dotnet-install.sh
<span class="nb">chmod</span> +x ./dotnet-install.sh
</code></pre></div></div>

<p>The installation is pretty much straightforward. Just define the specific major version with the <strong>–channel</strong> parameter to indicate a specific version.
The following command installs the .NET 7.0 SDK on your computer.</p>

<div class="language-bash highlighter-rouge"><div class="highlight"><pre class="highlight"><code>./dotnet-install.sh <span class="nt">--channel</span> 7.0
</code></pre></div></div>

<p>All necessary bits and bytes are installed by default under ~/.dotnet.</p>

<div class="language-bash highlighter-rouge"><div class="highlight"><pre class="highlight"><code><span class="nb">ls</span> <span class="nt">-l</span> ~/.dotnet
drwxr-xr-x. 1 stef stef     24 15. Nov 20:07 corefx
drwxr-xr-x. 1 stef stef      6  7. Dez 21:04 host
drwxr-xr-x. 1 stef stef      0  8. Dez 20:52 metadata
drwxr-xr-x. 1 stef stef    224  7. Dez 21:04 packs
drwxr-xr-x. 1 stef stef     28  7. Dez 21:16 sdk
drwxr-xr-x. 1 stef stef     28  7. Dez 21:07 sdk-advertising
drwxr-xr-x. 1 stef stef     52  7. Dez 21:16 sdk-manifests
drwxr-xr-x. 1 stef stef     90  7. Dez 21:04 shared
drwxr-xr-x. 1 stef stef   6300 27. Nov 19:00 symbolcache
drwxr-xr-x. 1 stef stef   3774  8. Dez 20:52 TelemetryStorageService
drwxr-xr-x. 1 stef stef     22  7. Dez 21:16 templates
drwxr-xr-x. 1 stef stef    112 27. Nov 18:55 tools
<span class="nt">-rwxr-xr-x</span><span class="nb">.</span> 1 stef stef 175832  7. Dez 21:04 dotnet
</code></pre></div></div>

<p>Once the installation has been completed successfully, two environment variables must be set so that the SDK can be accessed correctly from the console.
In your <strong>.bashrc</strong> set the following two environment variables:</p>

<div class="language-bash highlighter-rouge"><div class="highlight"><pre class="highlight"><code><span class="nb">export </span><span class="nv">DOTNET_ROOT</span><span class="o">=</span><span class="nv">$HOME</span>/.dotnet
<span class="nb">export </span><span class="nv">PATH</span><span class="o">=</span><span class="nv">$DOTNET_ROOT</span>:<span class="nv">$PATH</span>:<span class="nv">$DOTNET_ROOT</span>/tools
</code></pre></div></div>

<p><strong>DOTNET_ROOT</strong> variable is set to the folder .NET was installed to. And <strong>PATH</strong> should include both the <strong>DOTNET_ROOT</strong> folder and the user’s .dotnet/tools folder.</p>

<p>The correct installation can be checked relatively easily with the help of the <strong>dotnet command line tool:</strong></p>

<div class="language-bash highlighter-rouge"><div class="highlight"><pre class="highlight"><code>dotnet <span class="nt">--info</span>

Runtime Environment:
 OS Name:     fedora
 OS Version:  37
 OS Platform: Linux
 RID:         fedora.37-x64
 Base Path:   /home/stef/.dotnet/sdk/7.0.100/

.NET SDKs installed:
  6.0.403 <span class="o">[</span>/home/stef/.dotnet/sdk]
  7.0.100 <span class="o">[</span>/home/stef/.dotnet/sdk]

.NET runtimes installed:
  Microsoft.AspNetCore.App 6.0.11 <span class="o">[</span>/home/stef/.dotnet/shared/Microsoft.AspNetCore.App]
  Microsoft.AspNetCore.App 7.0.0 <span class="o">[</span>/home/stef/.dotnet/shared/Microsoft.AspNetCore.App]
  Microsoft.NETCore.App 6.0.11 <span class="o">[</span>/home/stef/.dotnet/shared/Microsoft.NETCore.App]
  Microsoft.NETCore.App 7.0.0 <span class="o">[</span>/home/stef/.dotnet/shared/Microsoft.NETCore.App]

Environment variables:
  DOTNET_ROOT       <span class="o">[</span>/home/stef/.dotnet]
</code></pre></div></div>

<h2 id="jetbrains-rider">JetBrains Rider</h2>

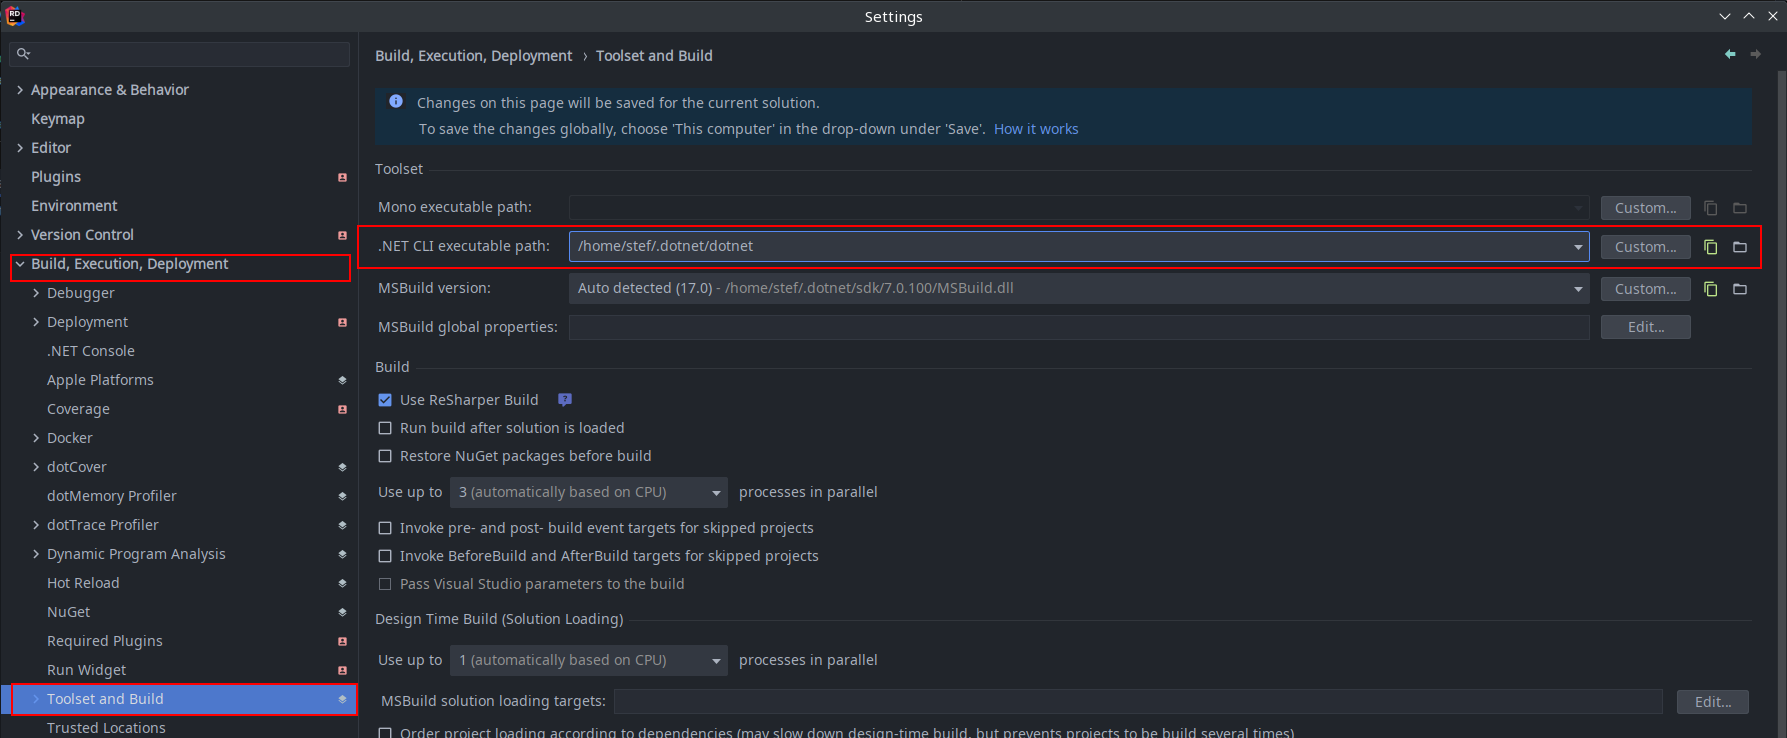
<p>In Rider I had the problem that the SDK was not recognized.
However, this can be fixed without much effort. Under <strong>File -&gt; Settings</strong> go to <strong>Build, Execution, Deployment</strong> and select <strong>Toolset and Build</strong>.</p>

<p><img src="/assets/images/rider-dotnet-7.0.png" alt=".NET 7.0 CLI executable path" /></p>

<p>Now change the <strong>.NET CLI executable path</strong> so that it matches your own installation.</p>]]></content><author><name>Stefan Geiger</name></author><category term="C#" /><category term=".NET" /><category term="Linux" /><category term="Fedora" /><summary type="html"><![CDATA[A few weeks ago .NET 7 was finally released by Microsoft with a lot of new features. Highly recommended is the article around the performance improvements (Performance Improvements in .NET 7) that have been made compared to .NET 6.0.]]></summary></entry><entry><title type="html">Use .NET 7 with Fedora 36 and Distrobox</title><link href="https://www.stefangeiger.ch/2022/09/08/dotnet-preview-fedora.html" rel="alternate" type="text/html" title="Use .NET 7 with Fedora 36 and Distrobox" /><published>2022-09-08T00:00:00+00:00</published><updated>2022-09-08T00:00:00+00:00</updated><id>https://www.stefangeiger.ch/2022/09/08/dotnet-preview-fedora</id><content type="html" xml:base="https://www.stefangeiger.ch/2022/09/08/dotnet-preview-fedora.html"><![CDATA[<p>A few days ago <a href="https://devblogs.microsoft.com/dotnet/announcing-dotnet-7-preview-7/">.NET 7 Preview 7</a> was officially announced by Microsoft. The current preview version of .NET will be the last preview for .NET 7 and the next version will be the first release candidate (RC). So it’s about time to download the latest binaries from Microsoft and try it out on my local developer machine.</p>

<p>Since this is still a preview (beta) version of .NET, I don’t want to mess up my current installation. As we all know, there are various options available for trying out new software versions or products like <a href="https://www.docker.com/"><strong>Docker</strong></a> or Virtual Machines (<a href="https://help.gnome.org/users/gnome-boxes/stable/"><strong>Gnome Boxes</strong></a> / <a href="https://www.virtualbox.org/"><strong>VirtualBox</strong></a>) and so on.</p>

<p>In this post I want to show how to install the latest .NET Preview version on <a href="https://getfedora.org/en/workstation/download/">Fedora 36 Workstation</a> without affecting the existing .NET installation. As an example I use Fedora 36 Workstation, but the steps mentioned below should also work fine under all Debian based distributions.</p>

<h2 id="setup">Setup</h2>

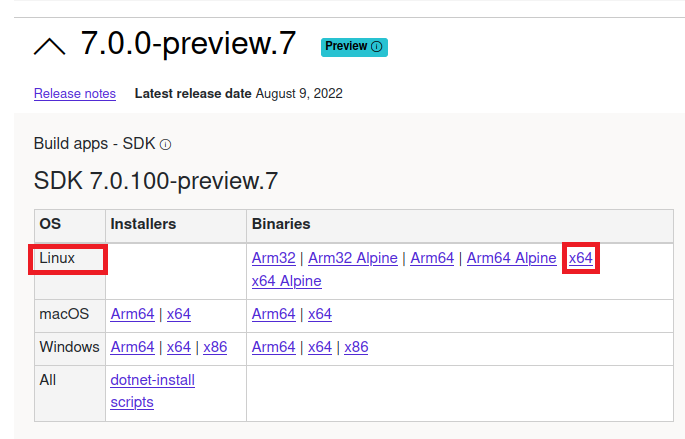
<p>First, head over to the official .NET download page <a href="https://dotnet.microsoft.com/en-us/download/dotnet">https://dotnet.microsoft.com/en-us/download/dotnet</a> and select the latest preview version, which is <strong>.NET 7.0</strong> in my case. Under <strong>SDK</strong>, select <strong>Linux</strong> and download the <strong>x64 binaries</strong>, or <a href="https://download.visualstudio.microsoft.com/download/pr/aabf15d3-f201-4a6c-9a7e-def050d054af/0a8eba2d8abcf1c28605744f3a48252f/dotnet-sdk-7.0.100-preview.7.22377.5-linux-x64.tar.gz">click this link</a></p>

<p><img src="/assets/images/dotnet-preview-fedora-download.png" alt=".NET 7.0 Preview Download" /></p>

<p>If you are already running .NET on your local linux system, then all the necessary dependencies should already be installed on your system. Otherwise visit <a href="https://docs.microsoft.com/en-us/dotnet/core/install/linux">https://docs.microsoft.com/en-us/dotnet/core/install/linux</a> for further information.</p>

<p>Create a dedicated direcory for the preview dotnet installation and extract the downloaded package into it</p>

<div class="language-bash highlighter-rouge"><div class="highlight"><pre class="highlight"><code><span class="nb">mkdir</span> <span class="nt">-p</span> <span class="nv">$HOME</span>/dotnet-preview
<span class="nb">tar </span>zxf dotnet-sdk-7.0.100-preview.7.22377.5-linux-x64.tar.gz <span class="nt">-C</span> <span class="nv">$HOME</span>/dotnet-preview
</code></pre></div></div>

<p>Define the necessary environment variables and that’s it</p>

<div class="language-bash highlighter-rouge"><div class="highlight"><pre class="highlight"><code><span class="nb">export </span><span class="nv">DOTNET_ROOT</span><span class="o">=</span><span class="nv">$HOME</span>/dotnet-preview
<span class="nb">export </span><span class="nv">PATH</span><span class="o">=</span><span class="nv">$HOME</span>/dotnet-preview:<span class="nv">$PATH</span>
</code></pre></div></div>

<p>Check if everything is working properly with <strong>dotnet –info</strong></p>

<div class="language-bash highlighter-rouge"><div class="highlight"><pre class="highlight"><code>dotnet <span class="nt">--info</span>

.NET SDK:
 Version:   7.0.100-preview.7.22377.5
 Commit:    ba310d9309

Runtime Environment:
 OS Name:     fedora
 OS Version:  36
 OS Platform: Linux
 RID:         fedora.36-x64
 Base Path:   /home/stef/dotnet-preview/sdk/7.0.100-preview.7.22377.5/
</code></pre></div></div>

<p><strong>Note:</strong> We set the environment variables for the terminal session in which it was run, so when you restart the computer or even the terminal, the <strong>.NET SDK commands</strong> would no longer be found, or the “old” version would be invoked.</p>

<h2 id="distrobox">Distrobox</h2>

<p>It is of course possible to store the corresponding variables in the shell profile (~/.bashrc), but this may affect the existing .NET installation.
And exactly for this problem <a href="https://github.com/89luca89/distrobox">Distrobox</a> is the perfect solution. From the official documentation:</p>

<blockquote>
  <p>Use any Linux distribution inside your terminal. Enable both backward and forward compatibility with software and freedom to use whatever distribution you’re more comfortable with. Distrobox uses podman or docker to create containers using the Linux distribution of your choice. <strong>The created container will be tightly integrated with the host, allowing sharing of the HOME directory of the user, external storage, external USB devices and graphical apps (X11/Wayland), and audio.</strong></p>
</blockquote>

<p>Checkout the <a href="https://distrobox.privatedns.org/#distrobox">official distrobox documentation</a> to explore all the possibilities or watch the introduction video on <a href="https://www.youtube.com/watch?v=Q2PrISAOtbY">Youtube by Jorge Castro</a>.</p>

<p>Distrobox is included in Fedora and can be easily installed with dnf</p>

<div class="language-bash highlighter-rouge"><div class="highlight"><pre class="highlight"><code><span class="nb">sudo </span>dnf <span class="nb">install </span>distrobox
</code></pre></div></div>

<p>Let’s create a new container based on Fedora 36 with a custom home directory under <em>~/.distrobox/dotnet-preview</em> and named <strong>dotnet-preview</strong></p>

<div class="language-bash highlighter-rouge"><div class="highlight"><pre class="highlight"><code><span class="nb">mkdir</span> <span class="nt">-p</span> ~/.distrobox/dotnet-preview
distrobox create <span class="nt">--image</span> fedora:36 <span class="nt">--name</span> dotnet-preview <span class="nt">--home</span> ~/.distrobox/dotnet-preview
</code></pre></div></div>

<p>Enter into your new container with the <em>distrobox enter</em> command</p>

<div class="language-bash highlighter-rouge"><div class="highlight"><pre class="highlight"><code>distrobox enter dotnet-preview
</code></pre></div></div>

<p>After the distrobox has been started, the following commands are executed in the container you’ve just created (dotnet-preview).
First, we install all updates and additional packages that are mandatory for dotnet</p>

<div class="language-bash highlighter-rouge"><div class="highlight"><pre class="highlight"><code><span class="nb">sudo </span>dnf upgrade <span class="nt">-y</span> <span class="o">&amp;&amp;</span> dnf <span class="nb">install </span>nano libicu <span class="nt">-y</span>
</code></pre></div></div>

<p>The next steps are almost identical as before, with the difference that this time the dotnet package is extracted under <strong>/opt</strong></p>

<div class="language-bash highlighter-rouge"><div class="highlight"><pre class="highlight"><code><span class="nb">sudo mkdir</span> <span class="nt">-p</span> /opt/dotnet-preview
<span class="nb">sudo tar </span>zxf dotnet-sdk-7.0.100-preview.7.22377.5-linux-x64.tar.gz <span class="nt">-C</span> /opt/dotnet-preview
</code></pre></div></div>

<p>And this time, we can persist the environment variables without touching the configuration of our main system</p>

<div class="language-bash highlighter-rouge"><div class="highlight"><pre class="highlight"><code><span class="nb">echo</span> <span class="s1">'export DOTNET_ROOT=/opt/dotnet-preview'</span> <span class="o">&gt;&gt;</span> ~/.bashrc
<span class="nb">echo</span> <span class="s1">'export PATH=$PATH:$DOTNET_ROOT:$DOTNET_ROOT/tools'</span> <span class="o">&gt;&gt;</span> ~/.bashrc
</code></pre></div></div>

<p>Now check your installation again with <strong>dotnet –info</strong></p>

<div class="language-bash highlighter-rouge"><div class="highlight"><pre class="highlight"><code>dotnet <span class="nt">--info</span>

.NET SDK:
 Version:   7.0.100-preview.7.22377.5
 Commit:    ba310d9309

Runtime Environment:
 OS Name:     fedora
 OS Version:  36
 OS Platform: Linux
 RID:         fedora.36-x64
 Base Path:   /opt/dotnet-preview/sdk/7.0.100-preview.7.22377.5/
</code></pre></div></div>

<p>Now every time i want to check one of my projects for .NET 7 compatibility, i simply start my distrobox, navigate to the project and run a <strong>dotnet build</strong> or <strong>dotnet run</strong>.</p>]]></content><author><name>Stefan Geiger</name></author><category term="C#" /><category term=".NET" /><category term="Linux" /><category term="Fedora" /><category term="Distrobox" /><summary type="html"><![CDATA[A few days ago .NET 7 Preview 7 was officially announced by Microsoft. The current preview version of .NET will be the last preview for .NET 7 and the next version will be the first release candidate (RC). So it’s about time to download the latest binaries from Microsoft and try it out on my local developer machine.]]></summary></entry><entry><title type="html">AKS - Nginx Ingress Controller Timeout</title><link href="https://www.stefangeiger.ch/2022/04/03/aks-ingress-timeout.html" rel="alternate" type="text/html" title="AKS - Nginx Ingress Controller Timeout" /><published>2022-04-03T00:00:00+00:00</published><updated>2022-04-03T00:00:00+00:00</updated><id>https://www.stefangeiger.ch/2022/04/03/aks-ingress-timeout</id><content type="html" xml:base="https://www.stefangeiger.ch/2022/04/03/aks-ingress-timeout.html"><![CDATA[<p>We run various applications in Kubernetes with the <a href="https://docs.microsoft.com/en-us/azure/aks/">Azure Kubernetes Service (AKS)</a>. Most of the time this works without any problems.
Recently, however, we had the problem that one was no longer working properly and the http request, triggered by an angular application, was always terminated with an <a href="https://developer.mozilla.org/en-US/docs/Web/HTTP/Status/504">504 Gateway Timeout</a>.</p>

<p><img src="/assets/images/k8s-504-timeout.png" alt="504 Gateway Time-out" /></p>

<p>The application runs as a <a href="https://kubernetes.io/docs/concepts/services-networking/service/">Kubernetes Service</a> behind a <a href="https://kubernetes.github.io/ingress-nginx/">NGINX Controller</a>. To get to the root of the problem, it is probably helpful to take a closer look at the ingress logs with the help of <strong>kubectl logs:</strong></p>

<div class="language-shell highlighter-rouge"><div class="highlight"><pre class="highlight"><code>kubectl logs <span class="nt">-n</span> ingress-nginx ingress-nginx-controller-6d5f55986b-q9t7k <span class="nt">-f</span>

2022/02/07 19:52:42 <span class="o">[</span>error] 172#172: <span class="k">*</span>3825 upstream timed out <span class="o">(</span>110: Operation timed out<span class="o">)</span> <span class="k">while </span>reading response header from upstream, client: 192.168.49.1, server: my-app.ch, request: <span class="s2">"GET /api/slow HTTP/1.1"</span>, upstream: <span class="s2">"http://172.17.0.2:80/api/slow"</span>, host: <span class="s2">"my-app.ch"</span>
2022/02/07 19:52:43 <span class="o">[</span>error] 172#172: <span class="k">*</span>3825 upstream timed out <span class="o">(</span>110: Operation timed out<span class="o">)</span> <span class="k">while </span>reading response header from upstream, client: 192.168.49.1, server: my-app.ch, request: <span class="s2">"GET /api/slow HTTP/1.1"</span>, upstream: <span class="s2">"http://172.17.0.2:80/api/slow"</span>, host: <span class="s2">"my-app.ch"</span>
2022/02/07 19:52:44 <span class="o">[</span>error] 172#172: <span class="k">*</span>3825 upstream timed out <span class="o">(</span>110: Operation timed out<span class="o">)</span> <span class="k">while </span>reading response header from upstream, client: 192.168.49.1, server: my-app.ch, request: <span class="s2">"GET /api/slow HTTP/1.1"</span>, upstream: <span class="s2">"http://172.17.0.2:80/api/slow"</span>, host: <span class="s2">"my-app.ch"</span>
192.168.49.1 - - <span class="o">[</span>07/Feb/2022:19:52:44 +0000] <span class="s2">"GET /api/slow HTTP/1.1"</span> 504 562 <span class="s2">"-"</span> <span class="s2">"Mozilla/5.0 (X11; Fedora; Linux x86_64) AppleWebKit/537.36 (KHTML, like Gecko) Chrome/98.0.4758.80 Safari/537.36"</span> 459 3.003 <span class="o">[</span>myapp-myapp-80] <span class="o">[]</span> 172.17.0.2:80, 172.17.0.2:80, 172.17.0.2:80 0, 0, 0 1.000, 1.002, 1.001 504, 504, 504 77e32c15c5339f90fb10c7f195f887e4
</code></pre></div></div>

<p>The logs quickly show where the problem lies. There is obviously a problem with the communication between the <a href="https://kubernetes.github.io/ingress-nginx/">NGINX Ingress Controller</a> and our application. It looks like the API call to <strong>http://172.17.0.2:80/api/slow</strong> runs into a timeout.</p>

<p>The configured timeout in nginx can be easily found out. For this we only have to output the file <strong>/etc/nginx/nginx.conf</strong></p>

<div class="language-shell highlighter-rouge"><div class="highlight"><pre class="highlight"><code>kubectl <span class="nb">exec</span> <span class="nt">-it</span> <span class="nt">-n</span> ingress-nginx ingress-nginx-controller-6d5f55986b-dwnw8 <span class="nt">--</span> <span class="nb">cat</span> /etc/nginx/nginx.conf
</code></pre></div></div>

<p>There are <a href="https://kubernetes.github.io/ingress-nginx/user-guide/nginx-configuration/annotations/#custom-timeouts">various options to configure the timeouts on the nginx</a>.
Relevant for us is the property <a href="https://kubernetes.github.io/ingress-nginx/user-guide/nginx-configuration/configmap/#proxy-read-timeout">proxy-read-timeout</a> and this was set to 60s, which is the default.</p>

<div class="language-shell highlighter-rouge"><div class="highlight"><pre class="highlight"><code>proxy_read_timeout 60s<span class="p">;</span>
</code></pre></div></div>

<p>Unfortunately a quick fix for the affected api was not possible, so the timeout of the ingress had to be increased.
In our case, we’ve simply modified the YAML file by setting the annotation <a href="https://kubernetes.github.io/ingress-nginx/user-guide/nginx-configuration/configmap/#proxy-read-timeout"><strong>nginx.ingress.kubernetes.io/proxy-read-timeout</strong></a> to <strong>180</strong> to temporarily solve the problem.</p>

<div class="language-yaml highlighter-rouge"><div class="highlight"><pre class="highlight"><code><span class="na">apiVersion</span><span class="pi">:</span> <span class="s">networking.k8s.io/v1</span>
<span class="na">kind</span><span class="pi">:</span> <span class="s">Ingress</span>
<span class="na">metadata</span><span class="pi">:</span>
  <span class="na">labels</span><span class="pi">:</span>
    <span class="na">app</span><span class="pi">:</span> <span class="s">myapp</span>
  <span class="na">name</span><span class="pi">:</span> <span class="s">ingress-myapp</span>
  <span class="na">namespace</span><span class="pi">:</span> <span class="s">myapp</span>
  <span class="na">annotations</span><span class="pi">:</span>
    <span class="na">nginx.ingress.kubernetes.io/rewrite-target</span><span class="pi">:</span> <span class="s">/$1</span>
    <span class="na">nginx.ingress.kubernetes.io/proxy-read-timeout</span><span class="pi">:</span> <span class="s2">"</span><span class="s">180"</span>
<span class="na">spec</span><span class="pi">:</span>
  <span class="na">ingressClassName</span><span class="pi">:</span> <span class="s">nginx</span>
  <span class="na">rules</span><span class="pi">:</span>
    <span class="pi">-</span> <span class="na">host</span><span class="pi">:</span> <span class="s">my-app.ch</span>
      <span class="na">http</span><span class="pi">:</span>
        <span class="na">paths</span><span class="pi">:</span>
          <span class="pi">-</span> <span class="na">path</span><span class="pi">:</span> <span class="s">/(.*)</span>
            <span class="na">pathType</span><span class="pi">:</span> <span class="s">Prefix</span>
            <span class="na">backend</span><span class="pi">:</span>
              <span class="na">service</span><span class="pi">:</span>
                <span class="na">name</span><span class="pi">:</span> <span class="s">myapp</span>
                <span class="na">port</span><span class="pi">:</span>
                  <span class="na">number</span><span class="pi">:</span> <span class="m">80</span>
</code></pre></div></div>]]></content><author><name>Stefan Geiger</name></author><category term=".NET" /><category term="C#" /><category term="Azure" /><category term="Kubernetes" /><summary type="html"><![CDATA[We run various applications in Kubernetes with the Azure Kubernetes Service (AKS). Most of the time this works without any problems. Recently, however, we had the problem that one was no longer working properly and the http request, triggered by an angular application, was always terminated with an 504 Gateway Timeout.]]></summary></entry><entry><title type="html">IIS application initialization - troubleshooting</title><link href="https://www.stefangeiger.ch/2021/05/05/iis-application-initialization-troubleshooting.html" rel="alternate" type="text/html" title="IIS application initialization - troubleshooting" /><published>2021-05-05T00:00:00+00:00</published><updated>2021-05-05T00:00:00+00:00</updated><id>https://www.stefangeiger.ch/2021/05/05/iis-application-initialization-troubleshooting</id><content type="html" xml:base="https://www.stefangeiger.ch/2021/05/05/iis-application-initialization-troubleshooting.html"><![CDATA[<p>This post is the continuation of <a href="/2021/03/15/iis-application-initialization-setup.html">IIS application initialization - setup</a> and goes deeper into the analysis of possible problems with the use of the <a href="https://docs.microsoft.com/en-us/iis/get-started/whats-new-in-iis-8/iis-80-application-initialization">IIS application Initialization</a>.</p>

<p>There are many reasons why the application initialization feature may fail. If the actual process is not logged, you may not even notice that the initialization was not executed as desired. The problem is that the actual application has not been started yet. Therefore the error analysis is not trivial.</p>

<h2 id="analyzing-with-perfview">Analyzing with PerfView</h2>

<p>But you can track down the errors relatively quickly with <a href="https://github.com/microsoft/perfview">PerfView</a>. If you are unfamiliar with PerfView, there are <a href="http://channel9.msdn.com/Series/PerfView-Tutorial">PerfView video tutorials on Channel9</a>.</p>

<p>To trace the application initialization of your web site, select the “Collect” item in the main menu and then choose “Collect”, or press <strong>ALT+C</strong> (<a href="https://devblogs.microsoft.com/dotnet/improving-your-apps-performance-with-perfview/#perfview-trace-collection">click here for more details</a>). The only thing to consider now is the use of the Microsoft-Windows-IIS ETW Provider by selecting the <strong>IIS</strong> checkbox.</p>

<p><img src="/assets/images/iis-app-initialization-perfview-1.png" alt="Perfview Collect IIS Events" /></p>

<p>Start a trace with <strong>Start Collection</strong>. Now, go to the <a href="https://docs.microsoft.com/en-us/iis/get-started/getting-started-with-iis/getting-started-with-the-iis-manager-in-iis-7-and-iis-8">IIS Manager</a> and restart (start/stop) your IIS App Pool or simply press “Recycle” in the right pane under <strong>Application Pool Tasks</strong>. In Perfview you can stop the collection and double click on the <strong>Events</strong> node</p>

<p><img src="/assets/images/iis-app-initialization-perfview-3.png" alt="Perfview Analyze IIS Events" /></p>

<p>The <a href="https://channel9.msdn.com/Series/PerfView-Tutorial/PerfView-Tutorial-7-Using-the-Event-Viewer-in-ASPNET-Scenarios">events viewer</a> should now be displayed. It makes sense to filter the events by <strong>iis</strong></p>

<p><img src="/assets/images/iis-app-initialization-perfview-2.png" alt="Perfview Analyze IIS Events" /></p>

<h2 id="httpstatus-405---method-not-allowed">HttpStatus 405 - Method Not Allowed</h2>

<p>The application initialization module calls the endpoint specified under <strong>initializationPage</strong> via HTTP GET request.</p>

<div class="language-xml highlighter-rouge"><div class="highlight"><pre class="highlight"><code><span class="cp">&lt;?xml version="1.0" encoding="utf-8"?&gt;</span>
<span class="nt">&lt;configuration&gt;</span>
  <span class="nt">&lt;location</span> <span class="na">path=</span><span class="s">"."</span> <span class="na">inheritInChildApplications=</span><span class="s">"false"</span><span class="nt">&gt;</span>
    <span class="nt">&lt;system.webServer&gt;</span>
      <span class="nt">&lt;applicationInitialization</span> <span class="na">doAppInitAfterRestart=</span><span class="s">"true"</span> <span class="na">skipManagedModules=</span><span class="s">"true"</span><span class="nt">&gt;</span>
        <span class="nt">&lt;add</span> <span class="na">initializationPage=</span><span class="s">"/api/init/start"</span> <span class="nt">/&gt;</span>
      <span class="nt">&lt;/applicationInitialization&gt;</span>
    <span class="nt">&lt;/system.webServer&gt;</span>
  <span class="nt">&lt;/location&gt;</span>
<span class="nt">&lt;/configuration&gt;</span>
</code></pre></div></div>

<p>If the controller action does not allow a HTTP GET request, then a <strong>405 Method Not Allowed</strong> is returned from the controller. Look in PerfView for <a href="https://developer.mozilla.org/en-US/docs/Web/HTTP/Status/405"><strong>HttpStatus 405</strong></a> events like this:</p>

<p><img src="/assets/images/iis-app-initialization-perfview-4.png" alt="Perfview 405 Method Not Allowed" />
Therefore, the initialization routine must be able to be called via HTTP GET request. This is usually configured with the <a href="https://docs.microsoft.com/en-us/dotnet/api/microsoft.aspnetcore.mvc.httpgetattribute?view=aspnetcore-5.0">HttpGetAttribute</a> applied directly on the action</p>

<div class="language-csharp highlighter-rouge"><div class="highlight"><pre class="highlight"><code><span class="p">[</span><span class="n">ApiController</span><span class="p">]</span>
<span class="k">public</span> <span class="k">class</span> <span class="nc">InitController</span> <span class="p">:</span> <span class="n">ControllerBase</span>
<span class="p">{</span>
    <span class="k">private</span> <span class="k">readonly</span> <span class="n">ILogger</span><span class="p">&lt;</span><span class="n">InitController</span><span class="p">&gt;</span> <span class="n">_logger</span><span class="p">;</span>
    <span class="k">public</span> <span class="nf">InitController</span><span class="p">(</span><span class="n">ILogger</span><span class="p">&lt;</span><span class="n">InitController</span><span class="p">&gt;</span> <span class="n">logger</span><span class="p">)</span>
    <span class="p">{</span>
        <span class="n">_logger</span> <span class="p">=</span> <span class="n">logger</span><span class="p">;</span>
    <span class="p">}</span>

    <span class="p">[</span><span class="n">HttpGet</span><span class="p">]</span>
    <span class="p">[</span><span class="nf">Route</span><span class="p">(</span><span class="s">"api/init/start"</span><span class="p">)]</span>
    <span class="k">public</span> <span class="n">IActionResult</span> <span class="nf">AppInit</span><span class="p">()</span>
    <span class="p">{</span>
        <span class="n">_logger</span><span class="p">.</span><span class="nf">LogInformation</span><span class="p">(</span><span class="s">"app initializer"</span><span class="p">);</span>
        <span class="k">return</span> <span class="nf">Ok</span><span class="p">();</span>
    <span class="p">}</span>
<span class="p">}</span>
</code></pre></div></div>

<h2 id="httpstatus-401---unauthorized">HttpStatus 401 - Unauthorized</h2>

<p>Another common problem is the authentication of http requests. Within companies, windows authentication is often used in the intranet. however, <a href="https://docs.microsoft.com/en-us/iis/get-started/whats-new-in-iis-8/iis-80-application-initialization">IIS application Initialization</a> only works with endpoints that also allow anonymous calls. For this purpose, both the web server and the application must be configured accordingly.</p>

<p>In the case of IIS, anonymous authentication must <a href="https://docs.microsoft.com/en-us/iis/configuration/system.webserver/security/authentication/anonymousauthentication">be enabled</a>. In addition, the API must also allow an anonymous call. This is done with the <a href="https://docs.microsoft.com/en-us/dotnet/api/microsoft.aspnetcore.authorization.allowanonymousattribute?view=aspnetcore-5.0">AllowAnonymous-Attribute</a> applied on the corresponding controller action.</p>

<div class="language-csharp highlighter-rouge"><div class="highlight"><pre class="highlight"><code><span class="p">[</span><span class="n">ApiController</span><span class="p">]</span>
<span class="k">public</span> <span class="k">class</span> <span class="nc">InitController</span> <span class="p">:</span> <span class="n">ControllerBase</span>
<span class="p">{</span>
    <span class="k">private</span> <span class="k">readonly</span> <span class="n">ILogger</span><span class="p">&lt;</span><span class="n">InitController</span><span class="p">&gt;</span> <span class="n">_logger</span><span class="p">;</span>
    <span class="k">public</span> <span class="nf">InitController</span><span class="p">(</span><span class="n">ILogger</span><span class="p">&lt;</span><span class="n">InitController</span><span class="p">&gt;</span> <span class="n">logger</span><span class="p">)</span>
    <span class="p">{</span>
        <span class="n">_logger</span> <span class="p">=</span> <span class="n">logger</span><span class="p">;</span>
    <span class="p">}</span>

    <span class="p">[</span><span class="n">HttpGet</span><span class="p">]</span>
    <span class="p">[</span><span class="nf">Route</span><span class="p">(</span><span class="s">"api/init/start"</span><span class="p">)]</span>
    <span class="p">[</span><span class="n">AllowAnonymous</span><span class="p">]</span>
    <span class="k">public</span> <span class="n">IActionResult</span> <span class="nf">AppInit</span><span class="p">()</span>
    <span class="p">{</span>
        <span class="n">_logger</span><span class="p">.</span><span class="nf">LogInformation</span><span class="p">(</span><span class="s">"app initializer"</span><span class="p">);</span>
        <span class="k">return</span> <span class="nf">Ok</span><span class="p">();</span>
    <span class="p">}</span>
<span class="p">}</span>
</code></pre></div></div>

<p>If the controller action does not allow a Anonymous requests, then a <strong>401 Unauthorized</strong> is returned from the controller. Look in PerfView for <a href="https://developer.mozilla.org/en-US/docs/Web/HTTP/Status/401"><strong>HttpStatus 401</strong></a> events like this:
<img src="/assets/images/iis-app-initialization-perfview-5.png" alt="Perfview 401 Unauthorized" /></p>

<h2 id="httpstatus-301---web-site-requires-ssl">HttpStatus 301 - Web site requires SSL</h2>

<p>Usually websites in IIS are configured with an HTTP to HTTPS rule. This means that all HTTP requests are automatically redirected to HTTPS.
This is usually configured using the <a href="https://www.iis.net/downloads/microsoft/url-rewrite">URL Rewrite module</a>. An exemplary configuration of such a rule could look like this:</p>

<div class="language-xml highlighter-rouge"><div class="highlight"><pre class="highlight"><code><span class="cp">&lt;?xml version="1.0" encoding="utf-8"?&gt;</span>
<span class="nt">&lt;configuration&gt;</span>
    <span class="nt">&lt;system.webServer&gt;</span>
      <span class="nt">&lt;rewrite&gt;</span>
        <span class="nt">&lt;rules&gt;</span>
          <span class="nt">&lt;rule</span> <span class="na">name=</span><span class="s">"HTTP to HTTPS redirect for all requests"</span> <span class="na">stopProcessing=</span><span class="s">"true"</span><span class="nt">&gt;</span>
            <span class="nt">&lt;match</span> <span class="na">url=</span><span class="s">"(.*)"</span> <span class="nt">/&gt;</span>
            <span class="nt">&lt;conditions&gt;</span>
              <span class="nt">&lt;add</span> <span class="na">input=</span><span class="s">"{HTTPS}"</span> <span class="na">pattern=</span><span class="s">"off"</span> <span class="nt">/&gt;</span>
            <span class="nt">&lt;/conditions&gt;</span>
            <span class="nt">&lt;action</span> <span class="na">type=</span><span class="s">"Redirect"</span> <span class="na">url=</span><span class="s">"https://{HTTP_HOST}/{R:1}"</span> <span class="nt">/&gt;</span>
          <span class="nt">&lt;/rule&gt;</span>
        <span class="nt">&lt;/rules&gt;</span>
      <span class="nt">&lt;/rewrite&gt;</span>
    <span class="nt">&lt;/system.webServer&gt;</span>
<span class="nt">&lt;/configuration&gt;</span>
</code></pre></div></div>

<p>Application Initialization module isn’t working for web site configured to require HTTPS only. Look in PerfView for <a href="https://developer.mozilla.org/en-US/docs/Web/HTTP/Status/301"><strong>HttpStatus 301</strong></a> events like this:
<img src="/assets/images/iis-app-initialization-perfview-6.png" alt="Perfview HttpStatus 301" /></p>

<p>The initialization endpoint must be callable with http. For this to work, the existing URL rewrite rule has to be extended to allow http calls from the app initialization module:</p>

<div class="language-xml highlighter-rouge"><div class="highlight"><pre class="highlight"><code><span class="nt">&lt;rewrite&gt;</span>
    <span class="nt">&lt;rules&gt;</span>
        <span class="nt">&lt;rule</span> <span class="na">name=</span><span class="s">"No redirect on warmup request (request from localhost with warmup user agent)"</span>
        <span class="na">stopProcessing=</span><span class="s">"true"</span><span class="nt">&gt;</span>
            <span class="nt">&lt;match</span> <span class="na">url=</span><span class="s">".*"</span> <span class="nt">/&gt;</span>
            <span class="nt">&lt;conditions&gt;</span>
                <span class="nt">&lt;add</span> <span class="na">input=</span><span class="s">"{HTTP_HOST}"</span> <span class="na">pattern=</span><span class="s">"localhost"</span> <span class="nt">/&gt;</span>
                <span class="nt">&lt;add</span> <span class="na">input=</span><span class="s">"{HTTP_USER_AGENT}"</span> <span class="na">pattern=</span><span class="s">"Initialization"</span> <span class="nt">/&gt;</span>
            <span class="nt">&lt;/conditions&gt;</span>
            <span class="nt">&lt;action</span> <span class="na">type=</span><span class="s">"Rewrite"</span> <span class="na">url=</span><span class="s">"{URL}"</span> <span class="nt">/&gt;</span>
        <span class="nt">&lt;/rule&gt;</span>
        <span class="nt">&lt;rule</span> <span class="na">name=</span><span class="s">"HTTP to HTTPS redirect for all requests"</span> <span class="na">stopProcessing=</span><span class="s">"true"</span><span class="nt">&gt;</span>
            <span class="nt">&lt;match</span> <span class="na">url=</span><span class="s">"(.*)"</span> <span class="nt">/&gt;</span>
            <span class="nt">&lt;conditions&gt;</span>
                <span class="nt">&lt;add</span> <span class="na">input=</span><span class="s">"{HTTPS}"</span> <span class="na">pattern=</span><span class="s">"off"</span> <span class="nt">/&gt;</span>
            <span class="nt">&lt;/conditions&gt;</span>
            <span class="nt">&lt;action</span> <span class="na">type=</span><span class="s">"Redirect"</span> <span class="na">url=</span><span class="s">"https://{HTTP_HOST}/{R:1}"</span> <span class="nt">/&gt;</span>
        <span class="nt">&lt;/rule&gt;</span>
    <span class="nt">&lt;/rules&gt;</span>
<span class="nt">&lt;/rewrite&gt;</span>
</code></pre></div></div>

<p class="notice--info"><strong>Tip</strong>: Also read <a href="https://support.microsoft.com/en-us/help/2843964/application-initialization-module-fails-when-web-site-requires-ssl">Application Initialization module fails when web site requires SSL</a></p>

<h2 id="conclusion">Conclusion</h2>

<p>When using the <a href="https://docs.microsoft.com/en-us/iis/get-started/whats-new-in-iis-8/iis-80-application-initialization">IIS Application Initialization</a> feature always ensure your web site allows <a href="https://docs.microsoft.com/en-us/iis/configuration/system.webserver/security/authentication/anonymousauthentication">anonymous calls</a>. This means that the corresponding controller action specified in the web.config under <strong>initializationPage</strong> is marked with the <a href="https://docs.microsoft.com/en-us/aspnet/core/security/authorization/simple?view=aspnetcore-5.0"><strong>AllowAnonymous</strong> attribute</a>. Furthermore, the iis website must allow <a href="https://docs.microsoft.com/en-us/iis/configuration/system.webserver/security/authentication/anonymousauthentication">anonymous authentication</a>.</p>

<p>And finally, it is always a good idea to have the <a href="https://docs.microsoft.com/en-us/iis/configuration/system.webserver/httptracing/">IIS-HttpTracing module installed</a> on your IIS.</p>]]></content><author><name>Stefan Geiger</name></author><category term=".NET" /><category term="C#" /><category term="Debugging" /><category term="Perfview" /><category term="IIS" /><summary type="html"><![CDATA[This post is the continuation of IIS application initialization - setup and goes deeper into the analysis of possible problems with the use of the IIS application Initialization.]]></summary></entry><entry><title type="html">IIS application initialization - setup</title><link href="https://www.stefangeiger.ch/2021/03/15/iis-application-initialization-setup.html" rel="alternate" type="text/html" title="IIS application initialization - setup" /><published>2021-03-15T00:00:00+00:00</published><updated>2021-03-15T00:00:00+00:00</updated><id>https://www.stefangeiger.ch/2021/03/15/iis-application-initialization-setup</id><content type="html" xml:base="https://www.stefangeiger.ch/2021/03/15/iis-application-initialization-setup.html"><![CDATA[<p>With <a href="https://www.iis.net/">IIS 8.0</a> Microsoft has introduced a new feature called <a href="https://docs.microsoft.com/en-us/iis/get-started/whats-new-in-iis-8/iis-80-application-initialization">Application Initialization</a>. Application Initialization allows you to <strong>pre load</strong> some initialization tasks for your application <strong>before</strong> the application pool will handle
user requests. For example: you could initialize a cache with some static types, objects or files used by your application logic. From the official <a href="https://docs.microsoft.com/en-us/iis/get-started/whats-new-in-iis-8/iis-80-application-initialization#solution">MSDN Documentation</a></p>

<blockquote>
  <p>The IIS 8.0 Application Initialization feature enables website administrators to configure IIS 8.0 to proactively perform initialization tasks for one or more web applications. While an application is being initialized, IIS 8.0 can also be configured to return static content as a placeholder or “splash page” until an application has completed its initialization tasks.</p>
</blockquote>

<p>Before you can use <a href="https://docs.microsoft.com/en-us/iis/get-started/whats-new-in-iis-8/iis-80-application-initialization">Application Initialization Feature</a> you must ensure, the appropriate IIS Module
is installed on your web server. This can be done either by using the Server Manager or Powershell. In an elevated PowerShell prompt run the following command:</p>

<div class="language-powershell highlighter-rouge"><div class="highlight"><pre class="highlight"><code><span class="n">Enable-WindowsOptionalFeature</span><span class="w"> </span><span class="nt">-Online</span><span class="w"> </span><span class="nt">-FeatureName</span><span class="w"> </span><span class="nx">IIS-ApplicationInit</span><span class="w">
</span></code></pre></div></div>

<p><img src="/assets/images/iis-app-initialization.png" alt="Application Initialization Module" /></p>

<p class="notice--info"><strong>Tip</strong>: Use my <a href="https://github.com/gest01/iis-install">IIS feature installation script</a> for a complete setup of an IIS Server on Windows Server 2016/2019 and Windows 10.</p>

<h2 id="aspnet-core-demo">ASP.NET Core Demo</h2>

<p>Let’s start with a simple ASP.NET Core Api controller which acts as an entry point for the initialization. The idea behind this endpoint is to provide an API which will be
called by the <a href="https://docs.microsoft.com/en-us/iis/get-started/whats-new-in-iis-8/iis-80-application-initialization">IIS Application Initialization Module</a> to do some initialization tasks like data loading, caching etc. before the web sites handles user requests.</p>

<div class="language-csharp highlighter-rouge"><div class="highlight"><pre class="highlight"><code><span class="p">[</span><span class="n">ApiController</span><span class="p">]</span>
<span class="k">public</span> <span class="k">class</span> <span class="nc">InitController</span> <span class="p">:</span> <span class="n">ControllerBase</span>
<span class="p">{</span>
    <span class="k">private</span> <span class="k">readonly</span> <span class="n">ILogger</span><span class="p">&lt;</span><span class="n">InitController</span><span class="p">&gt;</span> <span class="n">_logger</span><span class="p">;</span>
    <span class="k">public</span> <span class="nf">InitController</span><span class="p">(</span><span class="n">ILogger</span><span class="p">&lt;</span><span class="n">InitController</span><span class="p">&gt;</span> <span class="n">logger</span><span class="p">)</span>
    <span class="p">{</span>
        <span class="n">_logger</span> <span class="p">=</span> <span class="n">logger</span><span class="p">;</span>
    <span class="p">}</span>

    <span class="p">[</span><span class="n">HttpGet</span><span class="p">]</span>
    <span class="p">[</span><span class="nf">Route</span><span class="p">(</span><span class="s">"api/init/start"</span><span class="p">)]</span>
    <span class="k">public</span> <span class="n">IActionResult</span> <span class="nf">AppInit</span><span class="p">()</span>
    <span class="p">{</span>
        <span class="n">_logger</span><span class="p">.</span><span class="nf">LogInformation</span><span class="p">(</span><span class="s">"app initializer"</span><span class="p">);</span>
        <span class="k">return</span> <span class="nf">Ok</span><span class="p">();</span>
    <span class="p">}</span>
<span class="p">}</span>
</code></pre></div></div>

<p>Since Application Initialization is an IIS feature, of course a web.config file is required to perform all necessary configurations.
<strong>Note</strong>: <em>/api/init/start</em> points to my api controller route</p>

<div class="language-xml highlighter-rouge"><div class="highlight"><pre class="highlight"><code><span class="cp">&lt;?xml version="1.0" encoding="utf-8"?&gt;</span>
<span class="nt">&lt;configuration&gt;</span>
  <span class="nt">&lt;location</span> <span class="na">path=</span><span class="s">"."</span> <span class="na">inheritInChildApplications=</span><span class="s">"false"</span><span class="nt">&gt;</span>
    <span class="nt">&lt;system.webServer&gt;</span>
      <span class="nt">&lt;applicationInitialization</span> <span class="na">doAppInitAfterRestart=</span><span class="s">"true"</span> <span class="na">skipManagedModules=</span><span class="s">"true"</span><span class="nt">&gt;</span>
        <span class="nt">&lt;add</span> <span class="na">initializationPage=</span><span class="s">"/api/init/start"</span> <span class="nt">/&gt;</span>
      <span class="nt">&lt;/applicationInitialization&gt;</span>
      <span class="nt">&lt;handlers&gt;</span>
        <span class="nt">&lt;add</span> <span class="na">name=</span><span class="s">"aspNetCore"</span> <span class="na">path=</span><span class="s">"*"</span> <span class="na">verb=</span><span class="s">"*"</span> <span class="na">modules=</span><span class="s">"AspNetCoreModuleV2"</span> <span class="na">resourceType=</span><span class="s">"Unspecified"</span> <span class="nt">/&gt;</span>
      <span class="nt">&lt;/handlers&gt;</span>
      <span class="nt">&lt;aspNetCore</span> <span class="na">processPath=</span><span class="s">"dotnet"</span> <span class="na">arguments=</span><span class="s">".\dotnet-iis-preload.dll"</span> <span class="na">stdoutLogEnabled=</span><span class="s">"true"</span> <span class="na">stdoutLogFile=</span><span class="s">".\logs\stdout"</span> <span class="na">hostingModel=</span><span class="s">"inprocess"</span> <span class="nt">/&gt;</span>
    <span class="nt">&lt;/system.webServer&gt;</span>
  <span class="nt">&lt;/location&gt;</span>
<span class="nt">&lt;/configuration&gt;</span>
</code></pre></div></div>

<p>Copy and Paste this web.config file into your Web-Project root directory and set <strong>Copy to Output Directory</strong> to <strong>always</strong> either in Visual Studio or directly inside csproj.</p>

<div class="language-xml highlighter-rouge"><div class="highlight"><pre class="highlight"><code><span class="nt">&lt;Project</span> <span class="na">Sdk=</span><span class="s">"Microsoft.NET.Sdk.Web"</span><span class="nt">&gt;</span>
  <span class="nt">&lt;PropertyGroup&gt;</span>
    <span class="nt">&lt;TargetFramework&gt;</span>net5.0<span class="nt">&lt;/TargetFramework&gt;</span>
  <span class="nt">&lt;/PropertyGroup&gt;</span>
  <span class="nt">&lt;ItemGroup&gt;</span>
    <span class="nt">&lt;Content</span> <span class="na">Update=</span><span class="s">"web.config"</span><span class="nt">&gt;</span>
      <span class="nt">&lt;CopyToOutputDirectory&gt;</span>Always<span class="nt">&lt;/CopyToOutputDirectory&gt;</span>
    <span class="nt">&lt;/Content&gt;</span>
  <span class="nt">&lt;/ItemGroup&gt;</span>
<span class="nt">&lt;/Project&gt;</span>
</code></pre></div></div>

<p>In the configuration file shown above, i have set the property <strong>stdoutLogEnabled</strong> to <strong>true</strong>, so that the correct functionality can be checked by using the built-in logging capabilities. In productive environments, this property should always be set to <strong>false</strong>. See <a href="https://docs.microsoft.com/en-us/aspnet/core/host-and-deploy/iis/logging-and-diagnostics?view=aspnetcore-5.0">Log creation and redirection</a> for further details.</p>

<p>Now, you’re ready to publish your web app using <a href="https://docs.microsoft.com/en-us/dotnet/core/tools/dotnet-publish">dotnet publish command</a></p>

<div class="language-plaintext highlighter-rouge"><div class="highlight"><pre class="highlight"><code>dotnet publish -o d:\temp\preload
</code></pre></div></div>

<p><a href="https://docs.microsoft.com/en-us/aspnet/core/host-and-deploy/iis/?view=aspnetcore-5.0">Create a new IIS-Site</a> and set the physical path to <strong>d:\temp\preload</strong>. For ASP.NET Core applications, the application pool must be set to <strong>No Managed Code</strong>.</p>

<p>On your site under “Advanced Settings” you must set <strong>Preload Enabled</strong> to <strong>true</strong>.
With this setting, IIS sends a “fake request” to the application every time it restarts or the associated application pool starts up.</p>

<p><img src="/assets/images/dotnet-iis-preload.png" alt="Application Initialization Module" /></p>

<p>As soon your application pool has been started, you should see your app initializers log entries under <strong>.\logs\stdout</strong></p>

<div class="language-plaintext highlighter-rouge"><div class="highlight"><pre class="highlight"><code>info: Microsoft.Hosting.Lifetime[0]
      Application started. Press Ctrl+C to shut down.
info: Microsoft.Hosting.Lifetime[0]
      Hosting environment: Production
info: Microsoft.Hosting.Lifetime[0]
      Content root path: D:\temp\preload
info: dotnet_iis_preload.Controllers.InitController[0]
      app initializer
</code></pre></div></div>

<p>this happens everytime your appliction pool has been started or the pool has been recycled.</p>

<p>The Application Initialization feature usually works quite well, but problems can occur depending on the configuration of your Web Site.
In order for the feature to work properly, a few conditions must be met. See my blog post <a href="/2021/05/05/iis-application-initialization-troubleshooting.html">IIS application initialization - troubleshooting</a> where I point out the possible problems and explain how to analyze and fix them.</p>]]></content><author><name>Stefan Geiger</name></author><category term=".NET" /><category term="C#" /><category term="IIS" /><summary type="html"><![CDATA[With IIS 8.0 Microsoft has introduced a new feature called Application Initialization. Application Initialization allows you to pre load some initialization tasks for your application before the application pool will handle user requests. For example: you could initialize a cache with some static types, objects or files used by your application logic. From the official MSDN Documentation]]></summary></entry></feed>